
A single overlap figure says a corpus diverges from a reference, without saying where or why. Yet the three defects it aggregates call for distinct corrections, and separating them costs less than treating the corpus as a block.
This article sets out that arrangement. It extends the article on the cost of image segmentation.
What overlap metrics measure
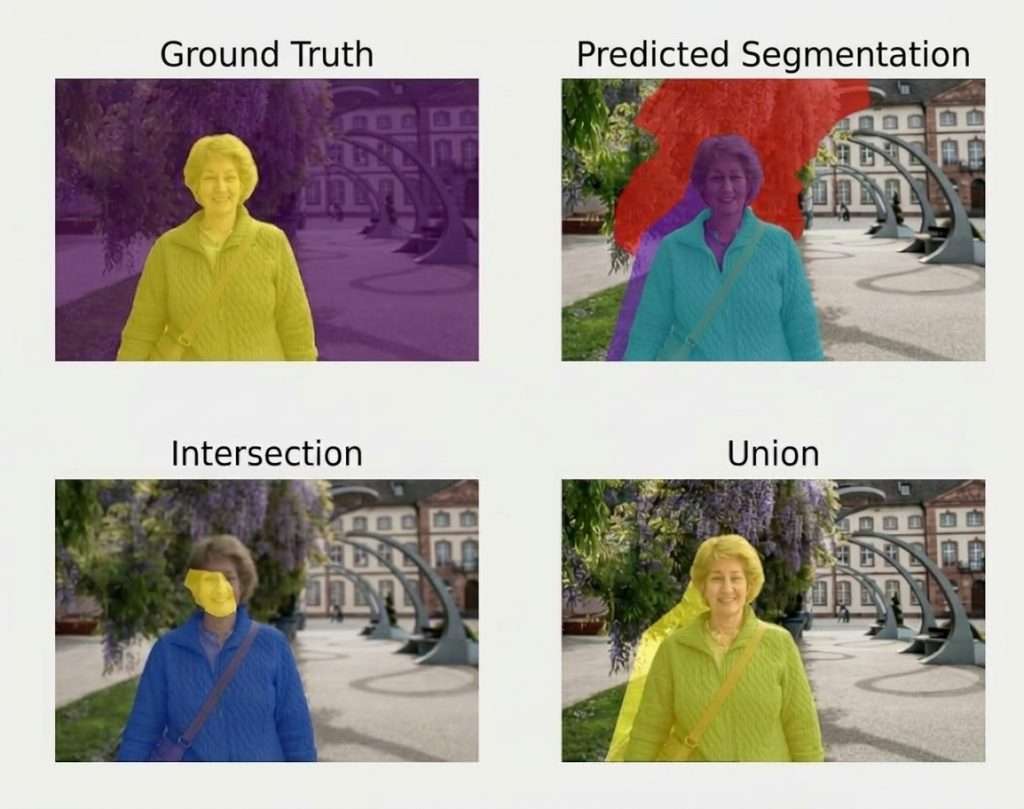
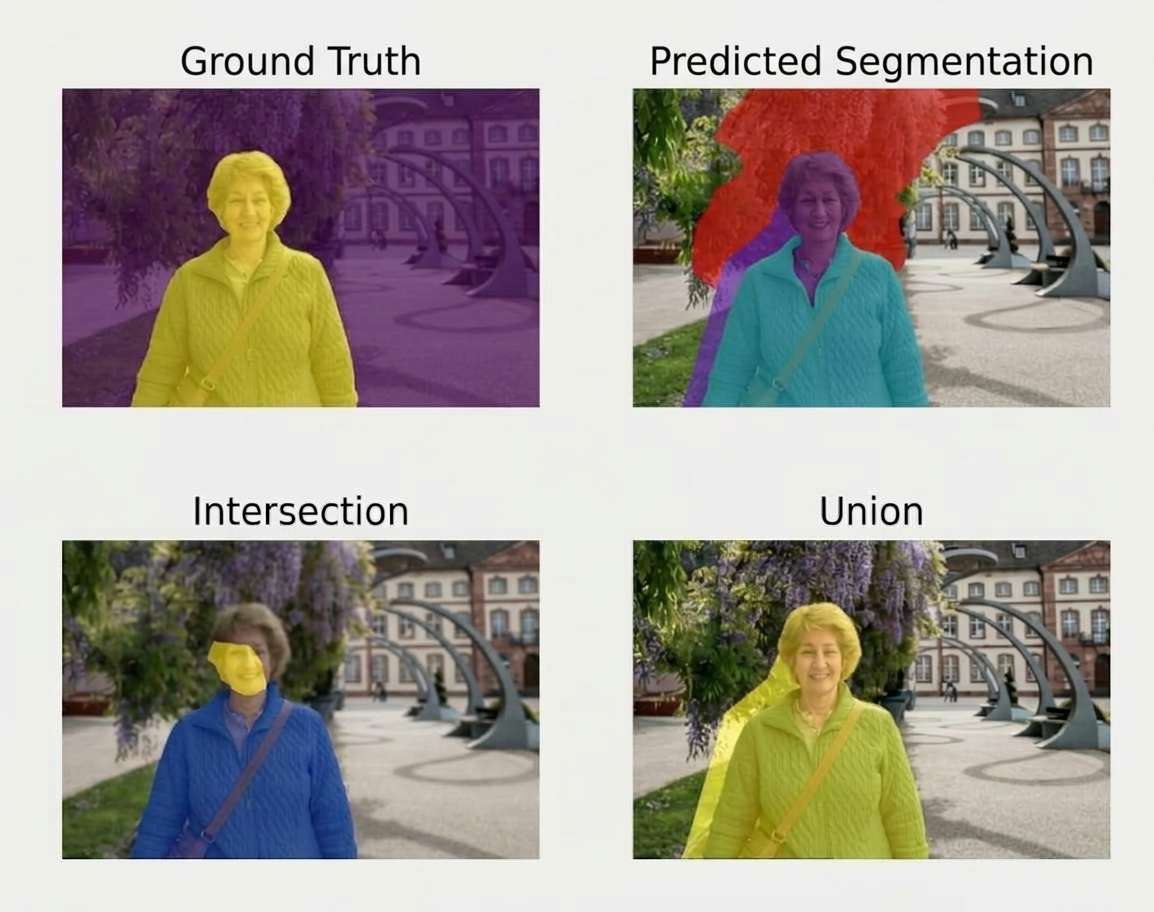
Two indicators dominate image segmentation. They express the same idea. They relate the surface common to two annotations to the surface they cover together. Three properties follow in image segmentation. The value rises where the two regions coincide and falls otherwise. It does not say whether the gap comes from a shift, an omission or a confusion. And it depends strongly on the region’s size, an identical contour gap weighing more on a small object. One important practical consequence follows. The third property makes an average over regions of unequal size hard to interpret in image segmentation, small regions weighing little there while they often concentrate what matters.The three defects overlap aggregates
A low image segmentation value can come from causes unrelated to each other. Three families are distinguishable in image segmentation. The boundary shift, where the region is correctly identified and badly delimited. The omission or the addition, where a whole region is missing or does not exist. And the class confusion, where the region is correctly traced and wrongly labelled. One important observation follows. Those three families call for different corrections, a placement convention for the first, reinforced control for the second and a nomenclature clarification for the third, which makes their aggregation expensive.What region size distorts
One effect deserves isolating since it produces misleading figures. Four consequences follow in image segmentation. An average per pixel is dominated by the large regions. An average per region gives the same weight to a tiny object and to a whole surface. A rare and small class can be missed entirely without the global value moving. And two corpora with the same global value can behave in opposite ways on small objects. One practical consequence follows. Those four effects require reporting values per class and per size band, a single figure masking precisely what most uses care about.Measuring where the stakes are
One method restricts the measurement to what counts in image segmentation. The principle is to compute agreement only within a band around the boundaries. Three benefits follow for an image segmentation project. Region interiors, where nobody makes mistakes, stop inflating the value. The indicator becomes sensitive to the gaps the work is actually about. And comparison between annotators becomes at last representative of their real disagreement. One important observation follows for an image segmentation project. That restriction completely changes the scale of the values obtained, which requires declaring the band width used or two measurements become incomparable.What boundary distance brings
A complementary indicator measures a different quantity. It expresses the gap between two contours in units of length rather than of area. Three advantages accompany it in image segmentation. It does not depend on the region’s size. It is expressed in the same unit as the contour tolerance, which makes the comparison direct. And its maximum value locates the worst gap instead of averaging it with the others. One important practical consequence follows. The second advantage makes it the natural indicator of a project that has fixed a quantified tolerance, conformity then being verified directly instead of going through an approximate conversion.What annotator disagreement bounds
One measurement precedes any requirement and it is often omitted. Two trained annotators handling the same images obtain different results. Three consequences follow in image segmentation. No corpus can be more consistent than that disagreement permits. A requirement above that value is untenable by construction. And an announced performance has meaning only against that ceiling. One important observation follows. That measurement is conducted on a few images in a day, and its absence leads to negotiating a requirement without knowing whether anyone can meet it.Separating the three families
One operation turns a figure into a diagnosis and it can be programmed. Three distinct calculations replace the single average in image segmentation. The rate of regions present in one annotation and absent from the other, which isolates omissions and additions. The rate of regions correctly located but wrongly labelled, which isolates class confusions. And the contour gap on the regions both correctly identified and correctly labelled, which isolates the shift. One important practical consequence follows. Those three calculations run on the same data as the single average, they require no additional measurement, and they indicate which of the three corrections to engage.What automatic control detects
Six image segmentation verifications run with no external reference. Pixels left without a class in a corpus that claims to be exhaustive. Regions of only a few pixels, the characteristic signature of slivers. Undeclared holes located inside annotated regions. Overlaps between regions in a formulation that forbids them. Class proportions aberrant against the corpus’s usual distribution. And area distributions shifted between annotators, revealing a systematic placement bias. One practical consequence follows for an image segmentation project. The last verification is the most effective and the least practised, a systematic bias being detectable on a distribution while it stays invisible region by region.What automatic control does not see
Four image segmentation defects escape any programmed verification. The omission of a region, which produces no formal anomaly. Systematic confusion between two classes, consistent and therefore plausible. The contour following the contrast rather than the convention. And the misapplication of a rule by an annotator who had misunderstood it. One observation follows. Those four defects require human control, which makes automatic and human two complementary arrangements rather than substitutable ones.What the rare class imposes
A measurement difficulty deserves setting out separately. A poorly represented class disappears from any average weighted by area. Four consequences follow in image segmentation. Its real performance appears nowhere in the global report. A uniform control sample almost never encounters it. Its total absence from the evaluation corpus goes unnoticed. And a system can fail entirely on that class without the global measurement signalling it. One important practical consequence follows. Those four effects require a table of counts per class alongside the performance table, the first column to examine being the number of occurrences rather than the value measured.How to sample
Four principles govern the control sampling of an image segmentation corpus. Targeting the classes with high variability rather than drawing uniformly. Including images with fragmented contours, where disagreement concentrates. Retaining the difficult configurations identified at the pilot batch. And keeping a constant sample from one batch to the next, the only way to measure a drift. One practical consequence follows. The first principle is the most effective, a uniform sample being dominated by the easy regions while most of the disagreement sits on a few classes.Framing a tenable requirement
A four-step method avoids an unachievable commitment. Measuring disagreement between annotators on the target classes. Separating the requirement per class, a sharp boundary and a soft transition not calling for the same value. Expressing the tolerance in units of length rather than in overlap, which makes it independent of size. And distinguishing the defect families from one another, omission and shift not carrying the same consequences at all. One important observation follows. The third step is the most useful and the least practised, a tolerance in pixels being verified directly where an overlap threshold depends on the size of the regions measured.The correction cycle
Four stages organise the improvement of an image segmentation corpus between batches. Running the automatic checks on the delivered batch. Separating the gaps into three families, shift, omission and confusion. Classing each defect as an individual error or a convention defect. And writing the missing rule before the next batch starts. One important practical consequence follows. The third stage produces a maturity indicator, a high share of convention defects signalling an incomplete reference rather than an insufficient team, which directs the effort towards documentation rather than towards training.The evaluation corpus and its requirements
One distinction deserves stating since this corpus follows its own rules. Four differences characterise it in image segmentation. Exhaustiveness becomes imperative, an omitted region counting as a false detection by the system evaluated. Double annotation is required on the classes with high variability, which supplies a firmer reference than a single reading. The composition must deliberately cover the difficult configurations, a set representative of the natural distribution measuring mostly the easy. And stability over time conditions any comparison between two successive versions of the system. One important observation follows. The third difference is the most misunderstood, an evaluation corpus having to measure what causes trouble rather than reflect how often situations occur.What the arrangement costs
Four lines compose the control arrangement of an image segmentation corpus. Setting up the automatic verifications, a one-off cost of a few hours. Running them, near nil and repeatable across every batch. Human review restricted to the boundaries and to the difficult classes. And double annotation of a sample, whose adopted rate determines the surcharge. One observation follows. The first line is the best returning, six verifications being programmed in a day and applying thereafter to every batch with no marginal cost.What measurement becomes on an assisted corpus
Three adaptations are required where assistance produces most of the regions. Comparing area distributions with a manual batch, which reveals the assisting model’s systematic shift. Verifying conformity with the convention rather than contour sharpness, the latter being guaranteed by construction. And tracking the rate of proposals discarded entirely, a direct indicator of a class badly suited to assistance. One important observation follows for an image segmentation project. The first adaptation is the only one detecting a constant shift, a uniformly displaced contour producing a high overlap and a systematically false area.What the report must contain
Six elements compose a useful control report in image segmentation. The sampling method and the band width used. The values per class rather than a single average. The distribution of gaps across the three defect families. The disagreement measured between annotators, which situates the performance. The evolution of the indicators from one batch to the next. And the list of configurations for which no stable convention could be settled. One practical consequence follows for an image segmentation project. The third element is the rarest and the most useful, it turns a finding into a diagnosis and directs the correction towards the convention, the control or the nomenclature according to the dominant family.What the corpus must declare
Six pieces of information accompany a quality report in image segmentation. The calculation method used, with the band width if the measurement is restricted to the boundaries. The weighting mode, per region or per pixel, which completely changes the reading. The counts per class alongside the values, without which a performance cannot be interpreted. The disagreement between annotators measured on the same classes. The composition of the evaluation corpus, notably its coverage of the difficult cases. And the list of configurations for which no stable convention was retained. One practical consequence follows. The second element is the one whose omission most distorts comparisons, two providers being able to show very different values on the same corpus according to the weighting they adopted.Demonstrating quality to a client
Four supports convince more reliably than an image segmentation rate. Superimposing an annotation on its image, which shows in seconds a coherence a figure leaves abstract. The performance table per class, which honestly situates what is achieved and what is not. The distribution of gaps across the three families, which demonstrates a diagnosis rather than a finding. And the disagreement measurement between annotators, which relates the performance obtained to the achievable ceiling. One observation follows for an image segmentation provider. The third support is the most distinctive, it shows a provider knows why their corpus diverges from the reference, information a global rate never carries.The minimal arrangement
Five measures frame an image segmentation corpus and their cost stays modest. The six automatic verifications, programmed before the first batch. The disagreement measurement between two annotators, conducted once at project start. The agreement computation restricted to a boundary band, with its width declared. The report per class, alongside the table of corresponding counts. And the separation of gaps into three distinct families, which turns the finding into a diagnosis. One observation follows. Those five measures take a small share of production time, they require no proprietary tooling, and they turn a quality claim into a verifiable fact.Approaching the control of a corpus
Five questions scope the control of an image segmentation corpus. Has disagreement between annotators been measured. Its value bounds any requirement. Does the measurement bear on a band around the boundaries. Its absence artificially inflates the values. Are the values reported per class. A single average masks the difficult classes. Are the defect families distinguished. Their aggregation prevents diagnosis. And is a constant sample kept between batches. Its absence makes drift undetectable. Those five answers determine the arrangement and its cost. Asking them before production avoids observing after the fact a defect the first batches already contained.The question that frames the measurement
One question determines which indicator to adopt. Does the downstream use exploit an area or a position. An area-oriented answer, an area measurement or a coverage proportion, calls for an overlap indicator reported per class and per size band. A position-oriented answer, an object’s contour or the limit between two zones, calls for a boundary distance, independent of size and directly comparable with a tolerance. That question is asked in one sentence, it belongs to the use and not to statistics, and it avoids steering a project with an indicator that measures something other than what counts.Three decisions before measuring
Three decisions make an image segmentation measurement interpretable. Measuring disagreement between annotators before fixing a requirement, which situates the achievable ceiling. Declaring the calculation method, band width included, without which two measurements do not compare. And planning the separation into three families when the arrangement is designed, which costs less than reconstituting it afterwards. Those three decisions cost a day, they precede the first batch, and their absence produces exact figures nobody knows what to do with.What this chapter leaves to the next
A practical difficulty conditions everything above. A measurement presupposes two annotations are comparable, which formats do not guarantee. Three obstacles occur in image segmentation. Two corpora in the same format can use different class identifiers. A resampling that happened at conversion shifts the masks without signalling it. And a vector representation converted to a mask loses fine detail the other corpus keeps. Those three obstacles mean comparability belongs to the format as much as to the method, and they constitute the subject of the following chapter.What this chapter teaches
One cross-cutting observation deserves closing this examination. A single indicator describes without diagnosing. Three findings compose it. Overlap aggregates three defect families that call for distinct corrections. Its value depends on region size, which makes an average hard to interpret and requires reporting per class. And boundary distance is expressed in the unit of the tolerance, which makes it the natural indicator of a quantified requirement. That finding extends the preceding chapters, the boundary remaining where quality is played out and where it must be measured.What to agree before the first measurement
One clause prevents most disputes about quality on this task. Agree the measurement protocol with the client before production, not at delivery. Three items belong in it for an image segmentation project. The calculation method and the weighting, since the same corpus yields very different figures under different choices. The measured annotator disagreement, which fixes what the requirement can reasonably be. And the composition of the evaluation set, which decides whether the measurement reflects the hard cases or the frequent ones. One practical consequence follows for an image segmentation provider. A protocol agreed upfront turns a delivery review into a comparison against a shared rule, which is a very different conversation from one where each party arrives with a figure computed its own way.The report a client can act on
One page carries what a quality report needs to be useful rather than reassuring. It holds four things and it fits alongside the delivery. A table of values per class with the count of occurrences beside each. The split of gaps across shift, omission and confusion, which says what to fix. The annotator disagreement measured on the same classes, which says how much room is left. And the calculation method, so the next batch’s figures compare with this one’s. One practical consequence follows for an image segmentation provider. A report built this way tells the client what to change rather than how well the provider did, which is the difference between a document that gets read and one that gets filed.Common mistakes
These failures recur often enough that naming them is usually enough to avoid them.- Reporting a single average for a whole corpus.
- Computing agreement over the whole surface rather than at the boundaries.
- Not declaring the band width used.
- Aggregating shift, omission and confusion in one figure.
- Fixing a requirement without having measured annotator disagreement.
- Expressing a tolerance in overlap rather than in length.
- Sampling uniformly rather than by difficult class.
- Neglecting to track area distributions between annotators.
- Expecting automatic control to detect omissions.
- Comparing two values obtained with different calculation methods.