The performance of a computer vision model depends on far more than its architecture or the sheer volume of training data fed into it. It is directly determined by the quality of the image annotation used to teach the model what to recognize. A single incorrectly labeled image (a bounding box placed around the wrong region, a class assigned to the wrong instance, an object left unmarked (introduces noise into the training dataset, and the resulting prediction errors can persist through multiple retraining cycles without being resolved.Measuring image annotation quality is therefore not a final-step formality: it is a methodological requirement that must be built into the project from day one. IoU, precision, recall, Cohen’s Kappa, the Dice coefficient), these metrics provide objective, reproducible indicators for assessing annotation reliability, detecting discrepancies between annotators, and deciding which corrections need to be made before training begins. This article explains how each metric works, what practical thresholds to apply, and how to integrate them into a structured quality assurance process, whether annotation is handled in-house or by a specialist provider.
Why measuring image annotation quality determines model performance
The quality of image annotation is measured by its ability to faithfully represent the reality that the model must learn to recognize. A correct annotation is one that matches what a trained expert would have produced, within the boundaries defined by the project guidelines. When systematic deviations emerge (bounding boxes that are consistently too loose, classes that are repeatedly confused, instances that are regularly omitted), the model learns a biased representation of the real world, and its production performance suffers accordingly.This connection between annotation quality and model performance has been demonstrated empirically across a wide range of industrial settings. In object detection, a drift of just a few pixels in bounding box boundaries can reduce the mAP score by several points. In semantic segmentation, inconsistent class definitions across annotators produce ambiguous regions that the model absorbs as normal (encoding the annotation error rather than learning to overcome it. Rigorous measurement of image annotation quality allows teams to catch these drifts before they contaminate the entire dataset, and before a costly re-annotation campaign becomes unavoidable.
Image annotation as the invisible foundation of machine learning
A poorly annotated dataset is like a blueprint with structural errors: the resulting building may appear sound on the surface, but the defects are locked into its foundations. The quality of image annotation does not manifest directly in loss curves during training; it reveals itself in production, in edge cases, in difficult lighting conditions, in partially occluded objects. Teams that invest in robust quality metrics consistently outperform those that rely on informal visual inspection, and the gap widens as the model moves into more demanding deployment environments.This dynamic is especially pronounced when training data diversity is low. A model trained on homogeneous images tends to memorize annotation biases rather than neutralize them, learning to reproduce the annotator’s systematic errors instead of learning the true visual characteristics of the target object. Correcting this type of drift after training is expensive and time-consuming; preventing it through upstream image annotation quality measurement is invariably the more cost-effective approach.
The hidden costs of poor image annotation quality
Beyond model performance, inadequately controlled image annotation generates significant hidden costs throughout the project lifecycle. Re-annotation campaigns, additional fine-tuning cycles, delayed production rollouts, and operational incidents together represent costs that, depending on project complexity, can reach multiples of the original annotation budget. Implementing quality metrics from the outset reduces these risks by enabling early detection of problems), when they are still correctable at low cost (rather than discovering them at the point of model validation or deployment.The question, therefore, is not whether quality control is cost-effective: it demonstrably is. The real decision is how intensively to apply it, so that the cost-benefit ratio is optimized for the specific application context), a question we address in the final section of this article.
IoU: the central metric for measuring image annotation precision
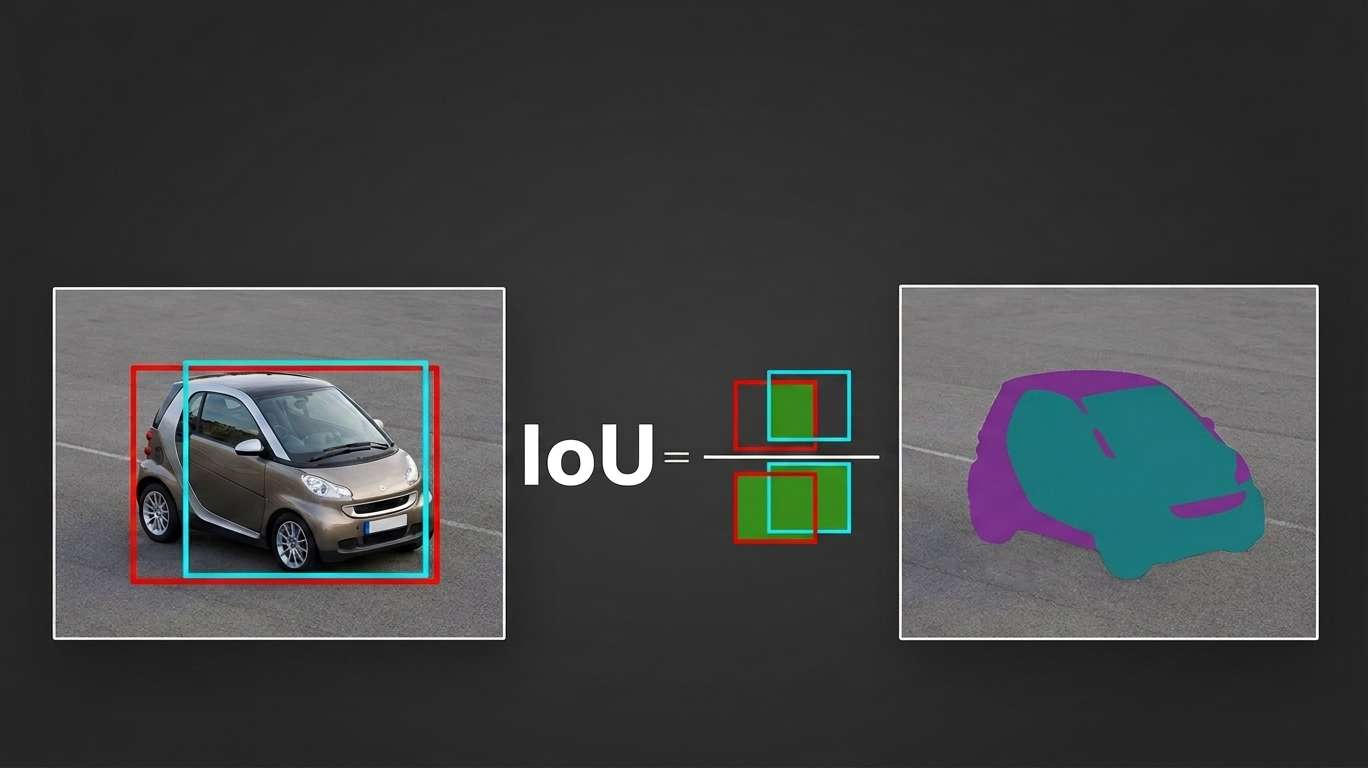
Intersection over Union (IoU) is the most widely used metric for assessing the geometric accuracy of image annotation in detection and segmentation tasks. It compares the overlap between a produced annotation and a reference annotation (the ground truth), relative to the total area covered by both. An IoU of 1 indicates a perfect match; an IoU of 0 means there is no overlap whatsoever between the evaluated annotation and the reference.IoU applies equally to rectangular bounding boxes, to polygonal segmentation masks, and to pixel-level segmentation. In all cases, the formula is identical: IoU = area of intersection / area of union. This combination of computational simplicity and direct interpretability makes IoU the reference standard for measuring image annotation quality in computer vision projects, from object detection to semantic segmentation to instance segmentation.
Practical IoU thresholds by use case
The IoU threshold above which an annotation is considered acceptable depends directly on the use case and the precision requirements of the end application. In object detection, the COCO benchmark uses an IoU threshold of 0.5 for the AP50 criterion and 0.75 for AP75. In practice, a threshold of 0.5 is generally sufficient for coarse detection applications (vehicle counting, presence detection, site surveillance), while applications requiring high localization accuracy demand thresholds above 0.75, or even 0.85 in the most demanding contexts.Semantic and instance segmentation apply IoU at the pixel level, making it far more sensitive to imprecise boundary tracing. An annotator who draws approximate contours around an object might achieve an IoU of 0.7 on a bounding box, but only 0.4 on the corresponding segmentation mask. Defining acceptance thresholds that reflect the type of image annotation being performed is therefore essential for ensuring that the metric is genuinely informative, and that contractual quality requirements are aligned with the technical realities of the project.For projects with complex taxonomies (multiple dozens of classes, objects of highly variable size, frequent occlusions), it is advisable to define differentiated IoU thresholds by class. Large, easily delineated objects can be held to higher thresholds than small objects or fine structures, for which annotation is inherently more variable and where natural inter-annotator differences are expected even among experienced practitioners.
The limits of IoU as a standalone image annotation quality metric
IoU does not capture every dimension of image annotation quality. It provides no information about class label correctness, is blind to classification errors, and cannot distinguish false positives from false negatives. A bounding box that is perfectly positioned around an object but assigned the wrong class will yield a high IoU score while constituting an incorrect annotation. This is why IoU is systematically used alongside complementary metrics (precision, recall, F1-score), to build a comprehensive picture of annotation quality across an entire dataset.There are also annotation types for which IoU is structurally ill-suited: keypoint annotation, image-level classification, relationship annotation between objects. For these tasks, alternative metrics such as OKS (Object Keypoint Similarity) for keypoints, or per-class accuracy for pure classification, must be employed in place of or alongside IoU to accurately reflect the quality of the annotation work produced.
Precision, recall and F1-score: broadening image annotation quality analysis
Precision and recall measure two complementary dimensions of image annotation quality when compared against a reference. Precision quantifies the proportion of positive annotations that are actually correct: it captures the annotator’s ability to avoid false positives (not to mark objects that do not exist, or not to assign the wrong class to a correctly localized object. Recall measures the proportion of objects that are genuinely present in the image and have been correctly annotated: it captures the ability to avoid false negatives, to not miss target objects.These two metrics are often in tension in real-world image annotation projects. A conservative annotator), who marks only objects they are certain about (achieves high precision but low recall. An annotator who marks everything that remotely resembles a target object achieves high recall but poor precision. The F1-score, the harmonic mean of precision and recall, provides a synthetic indicator that penalizes extreme imbalances between the two, and simplifies the comparison of annotation quality across multiple annotators working on the same image batch.
mAP: aggregating quality metrics across the full annotation dataset
Mean Average Precision), mAP (extends the precision-recall framework to an entire image annotation dataset, across all classes and IoU thresholds. It is calculated by integrating the precision-recall curve for each class, then averaging across all classes. mAP is the reference metric for object detection benchmarks), PASCAL VOC, COCO (and provides a standardized, project-agnostic way to compare annotations or models regardless of dataset-specific characteristics.In the context of image annotation quality control, mAP can be used to compare an annotator’s output against an expert-validated reference annotation. An annotator whose mAP consistently falls below the project threshold is flagged for additional training or guidance. This approach enables targeted corrective action rather than blanket re-annotation, preserving project budget and timeline while effectively addressing the root cause of the quality issue.
False positives and false negatives: asymmetric consequences for image annotation
In image annotation, false positives and false negatives do not carry equal weight across application domains. In medical imaging, a false negative), an undetected lesion, absent from the annotation and therefore invisible to the model in production (is far more consequential than a false positive that triggers an unwarranted alert. Conversely, in an industrial quality control system where false alarms carry significant operational costs, a high false positive rate may be more damaging than occasional misses.Understanding this asymmetry is essential for calibrating image annotation quality thresholds and for orienting annotator guidelines. In safety-critical projects, guidelines explicitly instruct annotators to err on the side of annotation rather than omission, accepting a higher false positive rate in exchange for maximizing recall. This intentional calibration must be documented in the annotation specifications and factored into the interpretation of quality control metrics during the review process.
Inter-annotator consensus: validating image annotation reliability at the process level
When the same image is annotated by multiple people, the results are never perfectly identical. These natural variations reflect each annotator’s individual interpretation of the guidelines, visual perception differences, and the inherent difficulty of certain objects or scenes. Measuring the level of inter-annotator consensus is fundamental to evaluating image annotation quality, because low agreement signals either ambiguous guidelines, an intrinsically difficult task, or annotators who have not received adequate training on the specific project context.Inter-annotator consensus metrics do not replace comparison-to-ground-truth metrics: they complement them by providing information about the reproducibility of the annotation process itself. An image annotation dataset can achieve a high average IoU against a reference while exhibiting low inter-annotator agreement, if all annotators share the same systematic bias. Conversely, strong inter-annotator agreement on an incorrect annotation signals a guideline problem rather than an individual competence issue), and should trigger a guideline revision rather than annotator retraining.
Cohen’s Kappa and Fleiss’ Kappa for annotation agreement
Cohen’s Kappa is a statistical measure of agreement between two annotators on a classification task, corrected for chance agreement. Its value ranges from -1 (total disagreement (to 1), perfect agreement), with 0 corresponding to chance-level agreement. The Landis and Koch scale, widely used as a reference in image annotation projects, classifies Kappa values below 0.4 as poor, 0.4 to 0.6 as moderate, 0.6 to 0.8 as substantial, and above 0.8 as near-perfect. In an industrial annotation project, a Kappa below 0.7 is generally a warning signal that justifies a guideline review or a collective calibration session before production continues at scale.Fleiss’ Kappa extends this framework to more than two annotators, which is more representative of real-world large-scale image annotation projects. It enables teams to identify which classes or object types generate the most disagreement, and to prioritize guideline clarification efforts where they will have the greatest impact on overall dataset quality. On projects with taxonomies of several dozen classes, some classes will naturally achieve high agreement (common, well-defined objects), while others, rarer or more subject to interpretation, will consistently require additional attention during training and calibration phases.
The Dice coefficient for segmentation consensus measurement
For segmentation tasks, the Dice coefficient (also known as the pixel-level F1-score), is often preferred over IoU for measuring inter-annotator agreement. Unlike IoU, which divides the intersection by the union, Dice divides twice the intersection by the sum of the two mask areas. The practical difference matters: Dice is more sensitive to small areas of agreement and tends to yield higher scores than IoU for the same level of overlap, which affects how thresholds are set in the project specifications for a given image annotation engagement.The Dice coefficient is particularly prevalent in medical image segmentation, where annotated structures can vary enormously in size (from a sub-centimeter nodule to an entire organ), and where small errors on fine anatomical structures carry significant clinical consequences. Its sensitivity to small regions makes it a more informative metric than raw IoU in these contexts, and acceptance thresholds in rigorous medical annotation projects are systematically defined on the basis of Dice rather than IoU.
Building a quality assurance process for image annotation projects
Measuring quality metrics in isolation is not sufficient to ensure a consistent level of quality throughout an image annotation project. It is the organization of the quality control process (the stages, roles, tools, and feedback loops), that ultimately determines the reliability of the final dataset. A robust process rests on three pillars: defining a quality reference (ground truth), detecting deviations early, and applying systematic corrections before delivery.Implementing such a process requires allocating dedicated resources to quality control, separate from the annotation resources themselves. In structured teams, quality control is performed by senior annotators or dedicated controllers, trained in the use of quality metrics and empowered to decide on corrections or rejections. This separation of roles (annotator and controller), is a defining characteristic of professional image annotation operations, and one of the key differentiators between a specialist provider and a generic crowdsourcing platform.
Honeypots and golden samples: continuous quality detection at scale
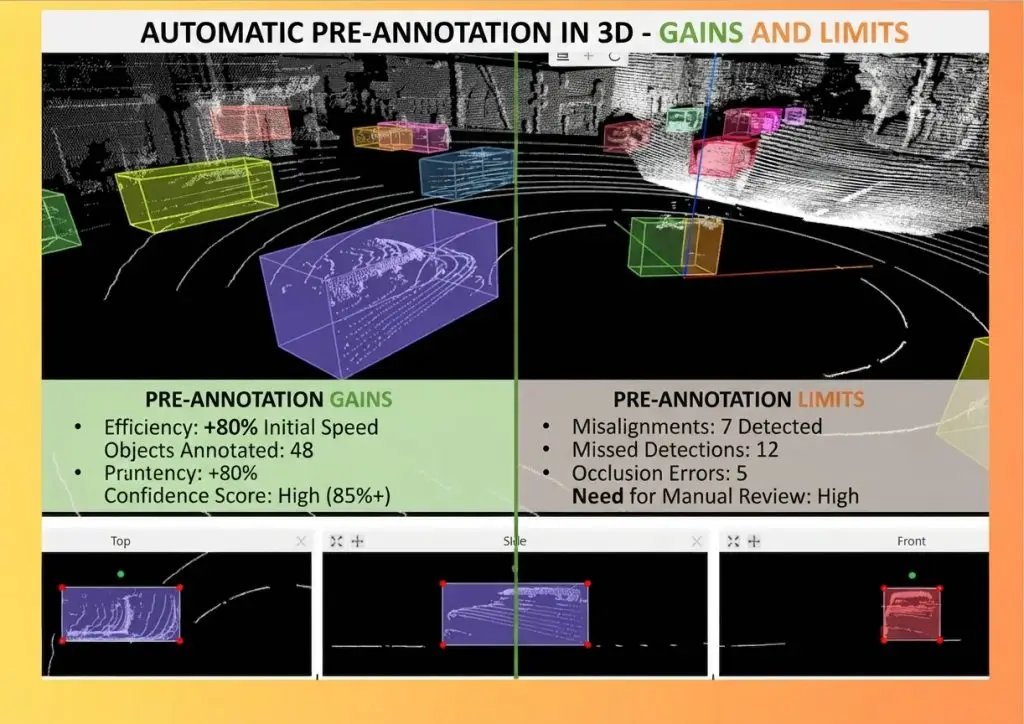
Honeypots and golden samples are automated mechanisms for detecting annotators whose output quality falls below acceptable thresholds. A golden sample is an image that has already been annotated by an expert, with the correct answer known and documented. When such a sample is inserted randomly into an annotator’s work queue (without the annotator knowing which images are test cases), their performance on these images provides a reliable, real-time estimate of their overall annotation quality. If their IoU or Kappa score on golden samples falls below the project threshold, their recent annotations are suspended and flagged for review before being integrated into the dataset.Honeypots operate on the same principle but are designed specifically to catch inattentiveness or lack of rigor (images where the correct annotation is unambiguous and any error clearly indicates insufficient care. Together, these mechanisms enable consistent image annotation quality on high-volume projects without requiring manual review of every single annotation produced, which would be economically impractical at any meaningful scale.
95%, 97%, 99% quality levels: calibrating control intensity to project requirements
The target quality level of an image annotation project determines the intensity of the quality assurance process required to achieve and maintain it. For a 95% quality objective, a full 100% review by controller-annotators combined with 25% independent sampling provides a level of oversight appropriate for exploratory or non-critical applications. To achieve 97%, independent sampling increases to 50% and a project manager review of 10% of deliveries is added. For projects requiring 99% quality), medical applications, aerospace and defense, critical industrial inspection (independent sampling covers 100% of all annotations, and annotator training shifts to a continuous regime with supervised daily sessions.This graduated approach allows quality assurance resources to be matched to the actual criticality of the end application, without systematically applying the most intensive protocols to projects that do not require them. It is at the core of what specialist providers in
image annotation for computer vision offer their clients: contractual, measurable quality commitments backed by documented and auditable verification processes.
Continuous improvement through structured feedback loops
A quality control process must do more than detect errors: it must generate actionable data for continuous improvement of guidelines, training, and workflows. Errors identified during control reviews are categorized), class error, boundary deviation, missing object, false positive (and aggregated by annotator, image type, and object class. This analysis identifies systematic friction points and enables targeted corrective action: rewriting an ambiguous guideline, adding illustrative examples, or organizing a collective recalibration session focused on the most problematic classes.On long-running or evolving projects), where guidelines are updated during production to refine the taxonomy or adapt to new object variants (this continuous feedback loop is essential for maintaining annotation consistency across the full dataset, including between batches produced before and after each guideline update.
What quality level should your image annotation project target?
The appropriate image annotation quality target depends primarily on the consequences of an error in the final application. For high-stakes systems), AI-assisted medical diagnosis, defect detection in aerospace components, advanced driver assistance (an incorrectly annotated image can translate directly into serious incidents in production. These sectors require quality levels of 97% to 99%, with corresponding process intensity. For less critical applications), e-commerce product classification, content moderation, plant species recognition (a 95% level is generally sufficient and keeps project costs manageable.Project volume is the second key parameter. On a project of 10,000 images, a full manual review is feasible with a limited team. On a project of several million images, it requires an industrial-scale organization: automated quality assurance tooling, validated statistical sampling protocols, and escalation procedures when drift is detected. For guidance on dimensioning the quality control effort correctly from the project scoping phase, our article on the full lifecycle of an
image annotation project for computer vision covers the criteria to consider in detail.The question of how annotation is produced), what proportion to automate, what proportion to entrust to human annotators, and how to combine the two) is addressed in our article on
manual versus automatic image annotation, which analyzes the cases where human involvement remains indispensable for guaranteeing the required quality level.Whatever your sector or application context, image annotation quality deserves a rigorous, documented, and measurable approach. To assess the right quality level for your specific project and the resources required to achieve it,
contact our team for a personalized analysis of your context and requirements.