
An inspection system is not judged on its accuracy. It is judged on how it distributes its errors between two categories whose costs bear no comparison, and that distribution is a setting, not a property of the model.
The scale of the problem is documented. A study on semiconductor inspection notes that under complex conditions, automated optical inspection systems produce false positives resulting in overkill rates above 20 per cent, which wastes perfect products and increases cost through the need for manual re-inspection. One product in five discarded wrongly, in an industry where unit value is high.
This article covers that asymmetry: how to name the errors, how to cost them, how to choose an operating point and why the usual metrics fall short. It extends the complete guide to defect detection.
Naming the errors in defect detection
Defect detection vocabulary differs between statistics and the shop floor, and that divergence is a source of misunderstanding in projects.Two vocabularies for the same objects
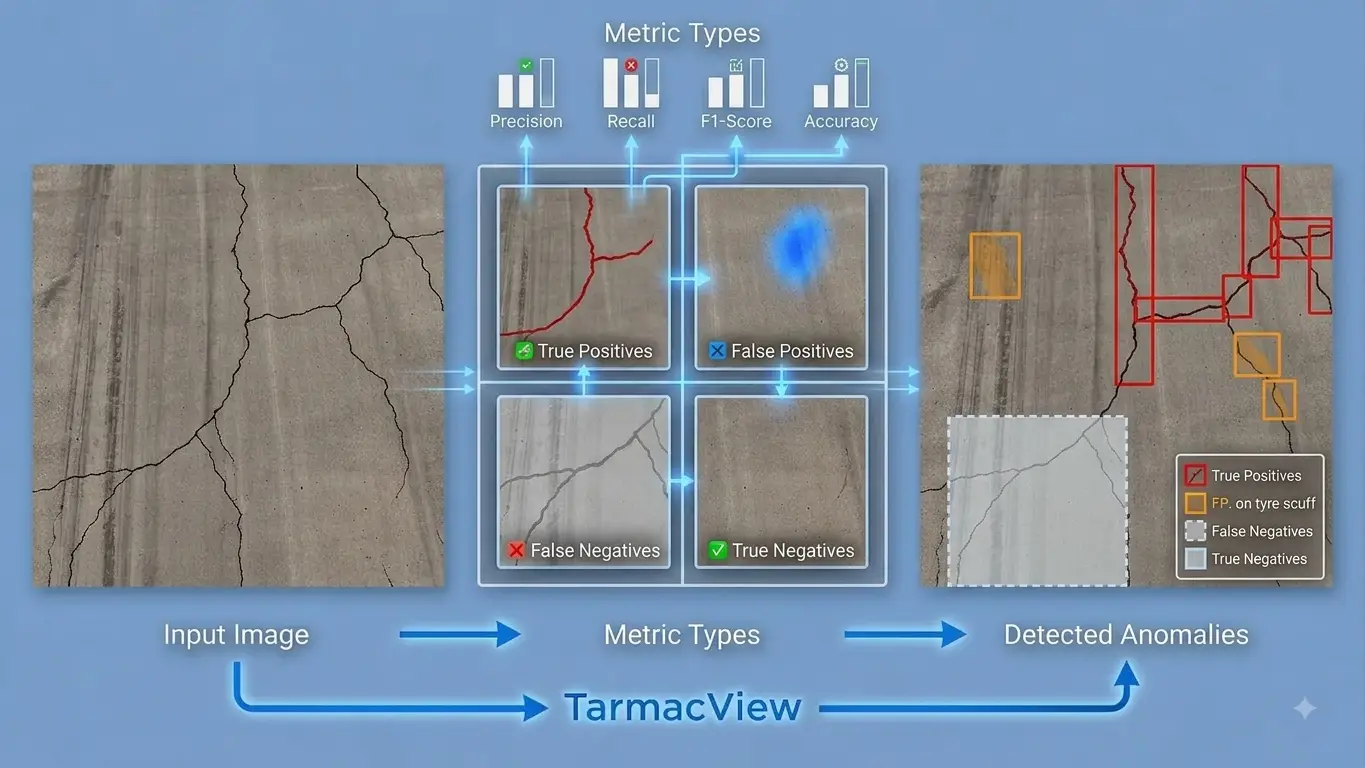
A false positive is a conforming part flagged as defective. The shop floor calls it a false reject, an overkill or a false alarm. A false negative is a defective part declared conforming. The shop floor calls it an escape or a miss. That duality is worth settling at project kickoff. A specification mixing both vocabularies produces discussions where each party believes they are talking about the same thing. The safest convention uses shop floor vocabulary in client exchanges, since it describes the real consequences, and reserves statistical vocabulary for technical documents.The positive class trap
A subtler confusion lurks. Depending on whether the defect or conformity is taken as the positive class, false positive and false negative swap. On an inspection system, the usual convention makes the defect the positive class, but it is not universal. The remedy is simple and rarely applied: never report a rate without naming explicitly what it counts. “Rate of conforming parts rejected” and “rate of defective parts accepted” carry no ambiguity, unlike “false positive rate” used alone.The asymmetry of costs in defect detection
This is the foundation of the whole argument, and the literature states it well. A study on anomaly detectors in imbalanced industrial settings puts it this way: a false negative on a defective product means it moves on to the next stage, an undesirable result, but the severity of the detection failure is fully dependent on the application; in the case of testing food for dangerous bacteria, a false negative could lead to consumer hospitalisation, whereas in the case of failing to detect a cosmetic issue such as a paint bubble, the risk of customer dissatisfaction is much lower; on the opposite side, a high false positive rate may lead to needless waste, expensive downtime, or alarm fatigue. The same source underlines a decisive point: depending on how a particular quality system is integrated into the production line, the false positive rate or the false negative rate may be more important than the overall error rate. In other words, global accuracy is not merely insufficient, it is structurally irrelevant.Costing both errors
Tuning presupposes knowing the ratio between the two costs, which requires work few projects undertake. The cost of a false reject comprises the value of the discarded part if it is destroyed, the manual verification time if it is re-examined, and the impact on line yield. It is generally direct, immediate and easy to establish. The cost of an escape is harder to pin down because it depends on where the defect will be discovered. Caught at the next stage, it costs rework. Caught at end of line, it costs more. Delivered to the customer, it costs the return, the replacement, possibly the downtime of an installation and damage to the commercial relationship. On critical products, it can cost legal liability. That reasoning leads to a useful observation: the cost of an escape rises steeply with the distance travelled before discovery. It is precisely the economic argument for placing inspection early in the chain, and it works better than any performance argument.The operating point
A defect detection model produces a continuous score, and the decision comes from a threshold applied to that score. Moving the threshold trades one error against the other without improving the model.An economic choice, not a technical one
The threshold choice belongs neither to the technical team nor to a statistical optimum. It follows from the cost ratio established above, hence from a decision by the quality function or industrial management. A provider delivering a threshold without having raised the cost ratio question has made that decision on the client’s behalf. Two reference points help place the usual cases. Where an escape is catastrophic, safety, health, critical component, the threshold is set towards maximum recall and the cost of false rejects is accepted as the price of safety. Where a false reject is directly destructive, product destroyed by the test, expensive material, critical throughput, the threshold is set towards precision and a downstream mechanism handles escapes.The question of the safety net
That last remark introduces the most decisive and most frequently neglected factor: is there a net downstream? A system placed ahead of a final human check can afford escapes, since they will be caught. A system placed last before shipment cannot. The same model performance therefore calls for opposite thresholds depending on its position in the chain, and that position must appear in the specification before any performance discussion.The threshold must stay adjustable
The cost ratio is not constant over time. It changes during a run on expensive material, in periods of schedule pressure, after a customer complaint, or by destination customer. The threshold must therefore be an operational parameter accessible from the interface, not a value frozen into the model. That presupposes the system outputs a score rather than a binary decision, an architecture choice made at the outset.Why accuracy means nothing
On an industrial flow, the defect rate runs to fractions of a per cent. A system declaring every part conforming would therefore post accuracy above ninety-nine per cent while being entirely useless. That arithmetic obviousness remains routinely overlooked in commercial pitches, where global accuracy is put forward precisely because it flatters on an imbalanced corpus. The rule is simple: on a defect detection task, a global accuracy figure tells you nothing and its presence in an offer is a warning sign. The useful metrics are those that separate the two errors. Recall measures the share of defects actually detected, hence the complement of the escape rate. Precision measures the share of flags that are correct, hence the inverse of the false reject rate. These two are reported together, never separately, and never aggregated into a single indicator where costs are asymmetric.The limits of the F1 score
The F1 score, the harmonic mean of precision and recall, is often used as a single indicator. It presupposes that both errors carry equal weight, which is exactly the assumption this domain invalidates. On a task where an escape costs a hundred times a false reject, optimising F1 leads to an economically absurd setting. Weighted variants exist and allow more weight to be given to recall or to precision. They are preferable to plain F1, but they require choosing the weighting, which returns to costing the errors. There is no shortcut around that question.The counting unit
One quiet source of error deserves separate treatment, because it distorts comparisons between offers. A false positive rate can be computed per image, per object, per part or per batch, and the resulting values differ by an order of magnitude. On an electronic board carrying thousands of inspection points, a very low false call rate per point produces a high probability that at least one point is wrongly flagged on every board. The practical consequence is that a rate quoted without its counting unit is uninterpretable, and that two offers showing the same figure can describe very different realities. The question to ask is always the same: that rate is computed per what.The severity threshold, a second decision
A frequent confusion in defect detection deserves clearing up: detection and the conformity decision are two distinct steps, each with its own threshold. A system can correctly detect a scratch and be wrong about whether it is disqualifying, or the reverse. A false reject can therefore stem from a detection error, an object seen where none exists, or from a grading error, a real defect judged more serious than it is. That distinction has an operational consequence. The two causes call for opposite corrections: the first belongs to the model and the corpus, the second to the severity threshold and therefore to the quality standard. An error report that does not separate them supports no corrective action, and yet it is the commonest presentation.Measuring honestly in defect detection
Three precautions distinguish a credible performance measurement from a decorative figure. The first is evaluation corpus representativeness. Performance measured on a balanced set does not predict behaviour on a flow where defects are rare. The false reject rate in particular can only be estimated on a representative volume of conforming parts, which presupposes the evaluation corpus contains many. The second is breakdown by class. Satisfactory global recall can mask collapsed recall on a rare class, and if that class is the most critical, the system is unusable despite a good overall figure. The third is measurement under real conditions. Performance obtained on a carefully built corpus, sharp and well-framed images, systematically overstates what the line will produce. The parallel running phase, where the system operates alongside existing inspection without deciding, remains the only way to obtain a reliable measurement.The performance contract
Translating all this into a contractual defect detection commitment requires precision, otherwise the contract covers unverifiable figures. Four elements must appear. The exact definition of both committed rates, with their counting unit. The corpus on which they will be measured, its composition and how it was built, ideally frozen and supplied by the client. The acquisition conditions under which the commitment holds, since a lighting drift alone can void it. And the breakdown by class, since a global commitment on a multi-class corpus is meaningless. One point deserves explicit negotiation: responsibility in the event of drift. A system delivered compliant then degraded by a material change or ageing lighting is not defective, but someone must take on restoring it. Providing for that case in the contract, rather than discovering it in operation, protects both parties and incidentally makes the provider credible.Drift of the operating point
A defect detection system correctly set at commissioning does not stay that way, and that drift is the commonest mode of degradation. Three distinct causes occur. Drift in acquisition conditions, ageing lighting, fouled optics, mechanical displacement, which shifts the score distribution and therefore the effect of the threshold. Product drift, a change of material, supplier or setting, which alters normal appearance. And prevalence drift, where the real defect rate changes, which alters the ratio of correct to incorrect flags without any error being attributable to the model. That last cause is instructive and often misunderstood. A system whose false call rate rises is not necessarily degraded: if production has improved and defects have become rarer, the proportion of wrong flags rises mechanically. Distinguishing model drift from prevalence drift requires tracking both separately. Minimum monitoring therefore comprises three indicators: the flag rate, the distribution of scores produced, and the confirmation rate of flags by manual verification. The first moves for many reasons, the second signals input drift, the third signals accuracy drift.Comparison against human inspection
One reference is regularly omitted from defect detection projects and yet necessary: the same rates applied to the existing arrangement. Human visual inspection also produces escapes and false rejects, and its rates are rarely measured. They depend on fatigue, time of day, throughput and operator experience, and they vary between individuals to a degree that surprises when measured. Establishing that reference before deploying a system has three virtues. It provides a realistic target rather than an abstract one. It avoids implicit comparison against a human inspection assumed perfect, which is the source of most disappointment. And it frequently reveals that the existing arrangement performs less well than believed, which moves the discussion from performance towards consistency and traceability, ground on which an automatic system is structurally superior.What annotation must make possible
Everything above imposes requirements on the defect detection corpus, and they are frequently discovered too late. The evaluation corpus must contain enough conforming parts to estimate the false reject rate with acceptable uncertainty, which is a volume well above intuition. A corpus composed mainly of defective examples, which happens often because they are harder to collect and therefore more prized, answers only half the question. It must also contain atypical conforming cases, those resembling defects without being any. They determine the false reject rate, and their under-representation produces a system whose precision collapses in production without the evaluation having warned of it. Finally, severity must be annotated separately from class, otherwise distinguishing a detection error from a grading error becomes impossible. That separation costs little in annotation and is worth a great deal in diagnosis.Presenting results to the client
How defect detection figures are presented largely determines the quality of the decision that follows. A useful presentation has three elements. The curve of both rates against threshold, which shows the trade-off rather than a single point and lets the client choose knowingly. The table broken down by class, which reveals where performance is achieved and where it is not. And a translation into physical consequences, expressed in parts over a real production volume rather than in percentages, since a two per cent rate speaks less than a number of parts per shift. That last translation is the most effective and the least practised. A production manager immediately grasps what forty wrongly rejected parts a day represents, where an abstract rate triggers no intuition. Doing that calculation for them, on their real volumes, turns a technical presentation into decision support.When both rates cannot be met
A situation arises often enough in defect detection projects to deserve naming: the client requires an escape rate and a false reject rate that the model cannot deliver simultaneously. The honest response is not to promise both and hope. It is to show the trade-off curve and let the client see where their two requirements sit relative to it. If both fall below the curve, no threshold setting reaches them and something else must change. Four levers exist, and they are worth presenting together. Improve acquisition, which shifts the whole curve rather than moving along it and is usually the cheapest option. Enrich the corpus on the classes where recall is failing, which shifts the curve where it matters. Reduce the scope to the defect classes actually detectable, accepting explicitly that others are out of reach. Or add a downstream verification stage, which changes the required operating point rather than the model. Presenting these four rather than accepting an impossible specification is the difference between a project that delivers something and one that delivers a dispute. It is also, in practice, how a provider establishes technical credibility early.The most common mistakes
These failures recur often enough across inspection projects that naming them is usually enough to avoid them.- Reporting global accuracy on a flow where defects are rare.
- Using statistical and shop floor vocabulary without an established convention.
- Quoting a rate without stating what it counts or by which unit.
- Optimising the F1 score although the two errors carry asymmetric costs.
- Setting the threshold on the technical side without costing the ratio with the client.
- Delivering a binary decision that cannot be adjusted in operation.
- Ignoring the system’s position in the chain and whether a downstream net exists.
- Evaluating on a balanced corpus and transposing to the real flow.
- Under-representing atypical conforming cases, which determine the false reject rate.
- Confusing model drift with prevalence drift in monitoring.