
One figure conveys the sector better than any market forecast. The European satellite data distribution service announced, on closing in favour of a newer platform, that it had provided over 67 million Sentinel products to approximately 750,000 users, disseminating 590 petabytes of data since entering service in 2014.
That data is free. The European Space Agency notes that a European Delegated Act provides free, full and open access to users of environmental data from the programme, including data from the Sentinel satellites. A massive resource with no access cost, which shifts the difficulty elsewhere.
This article presents the sector, its sensors, its players and what conditions the exploitation of its data. It opens a series devoted to it.
What Earth observation covers
Three families of platform coexist and their properties differ radically from one another.
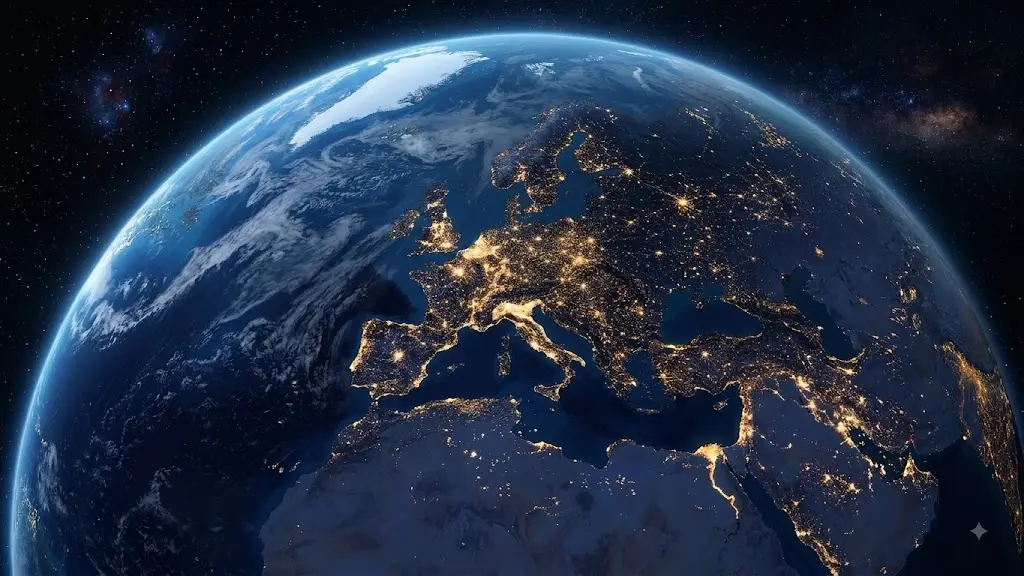
Earth observation covers the techniques allowing the properties of the land surface, the atmosphere and the oceans to be measured remotely, principally from space but also from aircraft.
Satellites offer global coverage, regular repetition and a resolution varying with orbit. They are the principal source and the subject of most of this series.
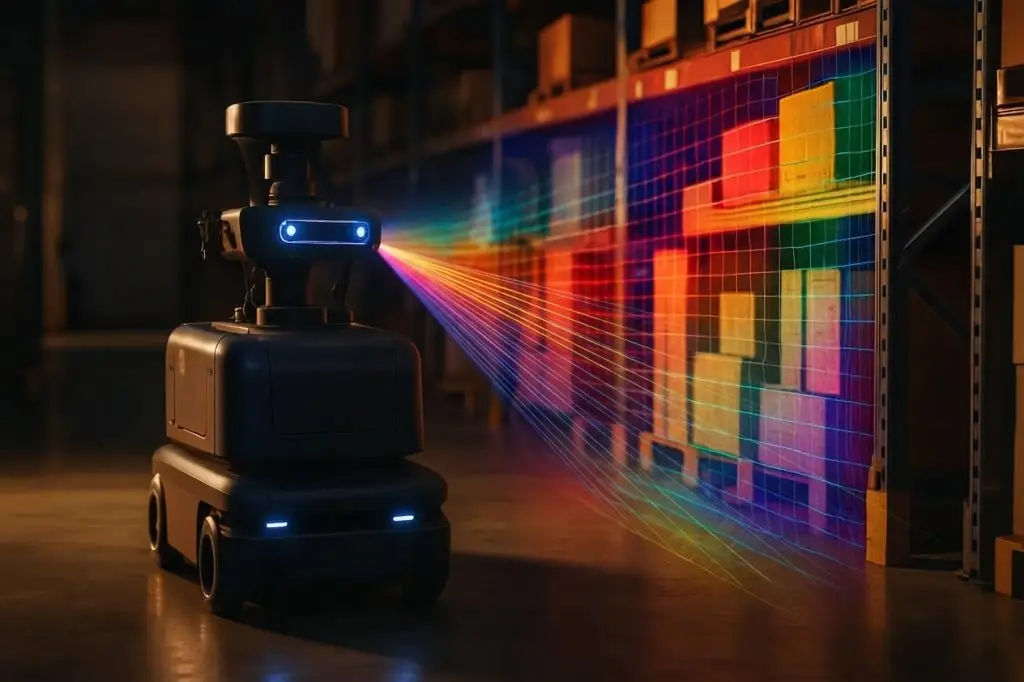
Airborne platforms, aircraft and drones, offer higher resolution over restricted areas, with acquisition on demand. They notably carry the laser ranging sensors discussed below.
Ground sensors complete the picture by supplying the reference measurements that allow satellite products to be validated, a subject one article in this series covers.
Those three families of platform combine rather than compete, each operational question calling for a trade-off between coverage, resolution and frequency.
Types of Earth observation sensor
This distinction conditions everything a given dataset will and will not permit.
Optical Earth observation sensors measure light reflected from the surface. They produce images close to what the eye would perceive, augmented by invisible spectral bands. Their limitation is major: they see neither at night nor through cloud.
Radar sensors emit their own signal and measure its echo. The space agency describes the first Sentinel mission as producing all-weather radar imagery, by day and by night. That property is decisive in frequently cloudy regions and for disaster response.
Hyperspectral sensors measure tens to hundreds of narrow bands, allowing material compositions rather than mere colours to be identified.
Thermal sensors measure emitted infrared radiation, and therefore surface temperature.
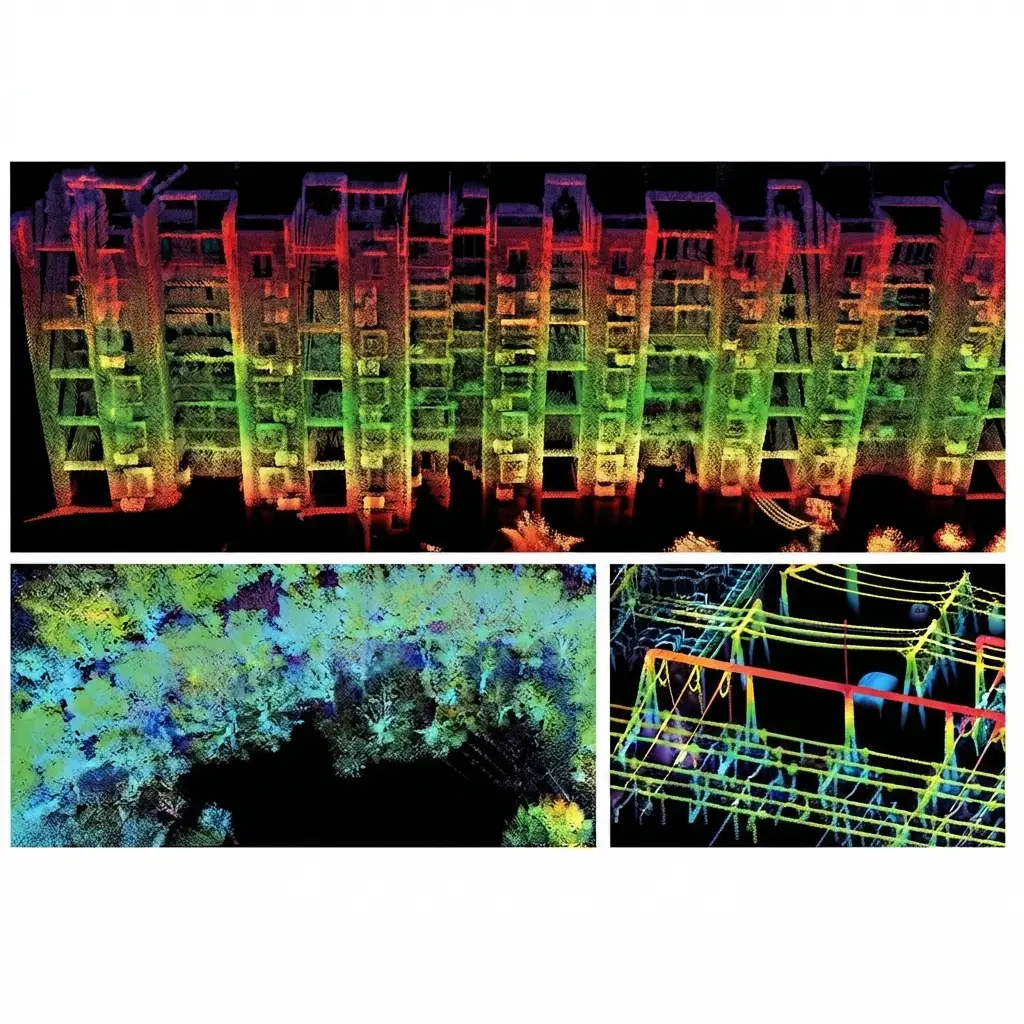
Altimeters and laser ranging sensors measure distances, producing elevation models and three-dimensional point clouds.
That diversity of sensors explains a recurring difficulty: one question may call for several sensors, and combining them requires a matching effort the following articles detail.
The four resolutions of an Earth observation dataset
Confusing them produces most of the misunderstandings encountered in the field.
Spatial resolution denotes the ground size of a pixel. It ranges from tens of metres for wide-coverage missions to a few tens of centimetres for the finest commercial satellites.
Temporal resolution denotes the interval between two acquisitions of the same point. It depends on the orbit and on the number of satellites in a constellation.
Spectral resolution denotes the number and width of the bands measured, determining what can be distinguished.
Radiometric resolution denotes the fineness of value encoding, conditioning the ability to distinguish subtle differences.
A physical trade-off binds those four parameters. A sensor cannot maximise all four simultaneously, a fine spatial resolution implying a narrow swath and therefore less frequent revisit. That constraint explains the coexistence of missions with very different profiles rather than convergence towards an ideal sensor.
Earth observation processing levels
Data is not usable in the state it is acquired, and the chain that makes it so has normalised stages.
Raw data leaves the sensor uncorrected. It serves only instrument specialists.
Geometrically and radiometrically corrected data is the first genuinely usable level. It is positioned on the Earth’s surface and its values are converted to physical quantities.
Atmospherically corrected data is the level most used for analysis, since the atmosphere alters the signal variably with conditions.
Derived products, vegetation indices, land cover maps or anomaly detections, form the highest level and result from thematic processing.
That gradation of levels has an immediate practical consequence. A project must know which level it works at, since comparing data from different levels produces wrong results with no error raised.
The players in Earth observation
Four families share the field and their economic logics differ substantially.
Public space agencies design and operate the major institutional missions. The European agency presents its flagship programme as the most ambitious Earth observation programme to date, and it forms the continent’s data foundation.
Commercial operators run constellations whose data is sold, generally at resolutions higher than those of public missions.
Service providers transform that data into thematic products for particular sectors, agriculture, insurance, energy or defence.
End users finally exploit those products without necessarily handling the source data.
One observation runs across those four families. Value is progressively shifting from the data towards the product, free access to massive volumes making raw data undifferentiating and thematic processing decisive.
The Earth observation data regimes
Two regimes coexist and their articulation determines a project’s cost.
The open regime, of which the European programme is the major example, makes medium resolution data available free with high repetition. The platform that succeeded the historical service gives access to a holding an infrastructure operator describes as already covering more than 50 petabytes of archive and current Earth observation data, estimated to grow to over 100 petabytes within six years.
The commercial regime offers finer resolutions, taskable acquisitions and guaranteed delays, at a cost one article in this series examines.
Those two regimes do not oppose one another. A typical project uses open data for coverage and regular monitoring, and turns to commercial sources for cases requiring a fineness or a responsiveness the free offering does not provide.
The trade-off is therefore made question by question, and it requires knowing what each regime permits, which the articles on data and on costs detail.
What artificial intelligence changes in Earth observation
It has transformed exploitation through a mechanism worth naming.
Available volume has long exceeded what human analysis can process. The 590 petabytes cited in the introduction are not looked at; they are processed.
Three families of task have been automated. Land cover classification, assigning a category to each pixel or each parcel. Object detection, of buildings, vehicles, vessels or infrastructure. And change detection, comparing two acquisitions of the same place.
A fourth family is emerging: prediction, exploiting time series to anticipate a development rather than observe a state.
Those automations have shifted the limiting factor. Data is abundant and free, models are available, and what is missing is the ground truth needed to train and evaluate them.
The annotated data bottleneck
This difficulty is central enough that a whole article of this series is devoted to it.
Annotating an Earth observation image means knowing what is on the ground, information the image does not always contain. Distinguishing one crop from another, a residential from an industrial building, or a forest clearing from a fire, requires knowledge the pixel does not supply.
Four specific difficulties complicate that work. Scale, one scene covering hundreds of square kilometres. Seasonal variability, one place changing appearance across the year. Geographic variability, one class not looking the same under different climates. And verification, ground truth sometimes requiring a survey on site.
Those four difficulties largely explain why annotated corpora are scarce relative to the volume of data available, and why they are geographically concentrated on a few well covered regions.
What distinguishes geospatial annotation
The work differs from ordinary image annotation on four points that shape tooling and skills.
Georeferencing is central. Each pixel corresponds to a position on the Earth’s surface, expressed in a coordinate system, and that information must be preserved at every stage.
Projection systems introduce a specific difficulty. Representing a curved surface on a plane requires a projection, and several coexist, whose confusion produces offsets.
Annotated objects are often very small relative to the scene, a few pixels for a vehicle in an image thousands of pixels across.
And classes are frequently defined by administrative convention rather than visual obviousness, a land cover nomenclature belonging to a regulatory reference.
Those four properties make geospatial annotation a distinct specialty, and they explain why tools and protocols differ from those used in other domains.
The main Earth observation application domains
Several of them are the subject of dedicated articles later in this series.
Agriculture uses crop monitoring, yield estimation and water stress detection, from indices computed on spectral bands.
Environment and climate exploit deforestation monitoring, ice measurement, air quality and shoreline evolution.
Security and defence use area surveillance, activity detection and damage assessment.
Insurance and finance exploit risk assessment, claim verification and exposure estimation.
Infrastructure and urban planning use mapping, construction monitoring and ground movement detection.
That diversity has a consequence for a data project: annotation conventions, classes and quality requirements vary strongly by domain, and a protocol designed for one does not transfer to another.
Recurring difficulties
Five of them recur in most Earth observation projects, and none is solved by better modelling.
Cloud cover limits the use of optical sensors, with rates making some regions hard to observe for part of the year.
Temporal availability does not always coincide with need, an event potentially occurring between two passes.
Source heterogeneity complicates aggregation, two sensors not measuring exactly the same thing.
Volume imposes a processing infrastructure not every project can assume.
And ground truth is the limiting factor, as noted above.
Those five difficulties are never resolved by choosing a better model, which matches a finding the clusters on other domains established.
Formats and tools in Earth observation
A project meets a technical ecosystem of its own, worth situating before choosing anything.
Raster formats dominate for imagery. The most widespread associates pixel values with their georeference in a single file, and a variant designed for remote access allows a portion of a scene to be read without downloading the whole, a decisive property given the volumes involved.
Vector formats carry delineated objects, parcel polygons, building footprints or road centrelines. They are the natural delivery format for geospatial annotation.
Point cloud formats carry laser ranging acquisitions, with conventions established by the three-dimensional mapping field.
Two categories of tool apply to those formats. Geographic information systems, allowing visualisation, editing and spatial analysis, and constituting the field’s reference tooling. And processing libraries, used for automated chains.
One practical observation applies. The field’s open-source tooling is mature and widely adopted, including in professional contexts, which considerably lowers the entry cost of a project.
Where to start in Earth observation
An order of approach appreciably reduces the learning time for a new team.
Start by exploring the open data, whose access requires only registration and which allows real scenes to be handled with no commitment.
Then identify the precise operational question, which determines the resolutions needed and therefore the relevant sensors.
Verify actual availability over the target area and period, cloud cover and revisit frequency being able to invalidate a project before it begins.
And estimate the ground truth available or obtainable, that estimate determining feasibility more than the technical choice does.
What the sector does not say enough
The field’s own discourse passes over three gaps that matter to a buyer.
The first concerns announced availability. A revisit of a few days is an orbital capability, not a guarantee of observation. Over a frequently cloudy region, the number of usable acquisitions per year can be a fraction of the number of passes.
The second concerns the accuracy of derived products. A land cover map generally announces an overall accuracy, a figure masking very uneven performance between classes, rare classes being systematically the worst served. The validation article returns to this point.
The third concerns transferability. A model trained on one region does not transfer mechanically to another, the appearance of the same classes differing with climate, agricultural practice and urban form. That limit is well documented and rarely highlighted.
Those three gaps share a feature. They belong not to the technology but to how results are presented, and knowing them changes how a project frames its requirements rather than how it chooses its tools.
What the Earth observation sector expects of a data provider
This observation situates what an annotation provider can contribute.
The bottleneck set out above has a direct consequence: the scarce competence is not handling satellite imagery, which is well tooled, but producing reliable and documented ground truth.
Three services follow. Building annotated corpora to a defined nomenclature, with the corresponding quality control. Documenting the corpus’s geographic and seasonal representativeness, which conditions how any performance figure is interpreted. And building evaluation sets covering areas and periods distinct from training.
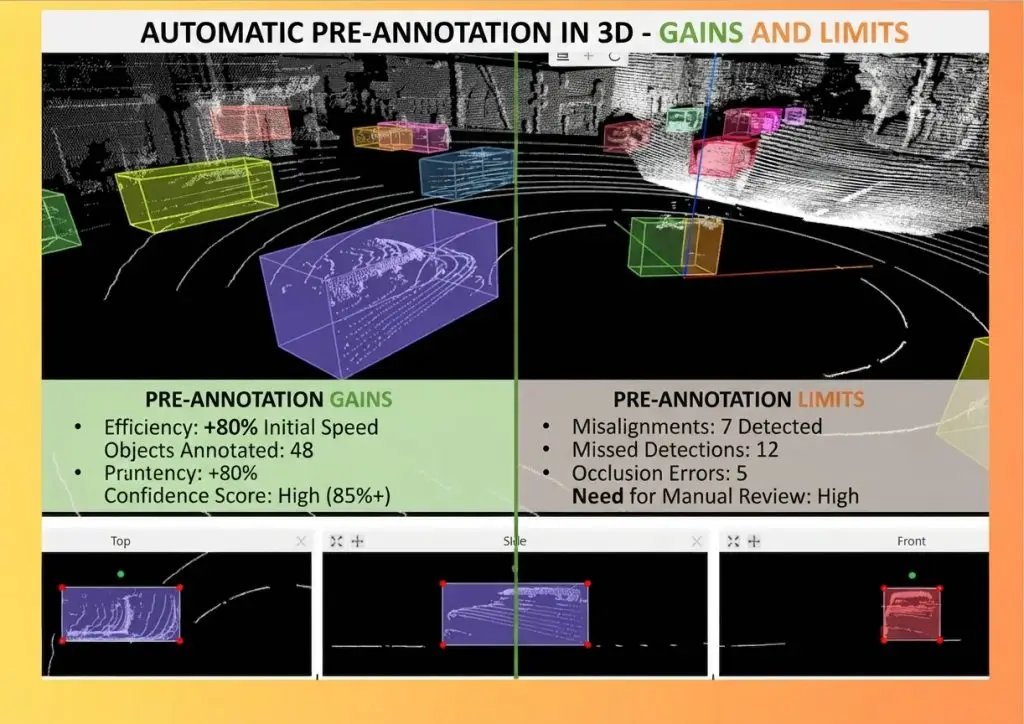
A fourth service, less obvious, deserves flagging: work on point clouds from laser ranging, whose segmentation requires tooling and competences distinct from those of raster imagery.
Those four lines share a feature. They concern what open data does not supply, which makes them complementary to the free resource rather than competing with it.
Scoping a first Earth observation project
Four questions determine the feasibility of an Earth observation project before any technical work is planned, and none requires expertise to answer.
What decision will change, and at what spatial and temporal granularity. A weekly answer over a region and a daily answer over a field call for entirely different data.
Is the phenomenon visible at the resolution available. Many operational questions concern objects or changes below the resolution of free data, which settles the cost question immediately.
What ground truth exists or can be obtained, and at what cost. Agricultural declarations, cadastral records and field surveys are the usual sources, and their availability varies enormously by country.
And over what area and period must the result hold. That question determines the evaluation design, since a model validated on one region says nothing about another.
Those four questions take a meeting. Answered honestly, they eliminate most infeasible projects before any budget is committed, and they shape the ones that remain.
Building the ground truth
Since ground truth is the limiting factor in Earth observation, it is worth setting out where it comes from.
Four sources exist and they differ in cost and reliability. Existing administrative records, cadastral or agricultural, which are cheap and reflect declarations rather than observation. Field surveys, which are reliable and expensive and cover small areas. Photo-interpretation by trained annotators on very high resolution imagery, which is the commonest compromise. And existing thematic maps, which carry their own errors into anything built on them.
That fourth source deserves caution. Using an existing map as ground truth propagates its errors and its nomenclature, and it caps achievable accuracy at that map’s own accuracy, which is rarely stated.
The practical arrangement most projects converge on combines them: administrative records for volume, photo-interpretation for refinement, and a small field survey to estimate the error rate of the other two. That third component is often omitted and it is what makes the first two interpretable.
The most common mistakes
These failures recur often enough that naming them is usually enough to avoid them.
- Confusing spatial resolution with positional accuracy.
- Comparing data from different processing levels.
- Choosing an optical sensor for a frequently cloudy area.
- Sizing a project without checking actual revisit over the target area.
- Assuming a class looks the same under every climate.
- Neglecting projection systems when aggregating sources.
- Treating geospatial annotation as ordinary image annotation.
- Underestimating the cost of building ground truth.
- Using an annotation protocol designed for another application domain.
- Expecting a better model to compensate for unavailable data.
- Confusing announced orbital revisit with the number of usable acquisitions.
- Relying on an overall accuracy without examining per-class performance.
Why the free data changes the economics
A closing observation on Earth observation ties the opening figure to what it means commercially.
In most data-intensive fields, acquiring the raw material is the dominant cost and the main barrier to entry. Earth observation inverted that. A team anywhere in the world can access the same petabytes as a national agency, at no cost, after registering.
Three consequences follow. Competitive advantage cannot rest on data access, since everyone has the same access. It rests instead on the thematic question asked, on the ground truth held, and on the ability to validate a product credibly.
The second consequence is that the barrier to entry moved rather than disappearing. Ground truth is expensive, geographically specific and slow to build, which makes it the durable asset the imagery is not.
The third is that this favours whoever can produce annotated data reliably at scale. That is an unusual position for a data provider to be in: in most sectors the annotation is a cost line, and here it is the scarce resource around which the value organises itself.
What to take away
Earth observation rests on a massive and largely free resource, the historical European service having disseminated 590 petabytes to some 750,000 users, which shifts the difficulty from access to exploitation.
Three readings emerge. Four resolutions characterise a dataset, spatial, temporal, spectral and radiometric, and a physical trade-off forbids maximising them simultaneously, which explains the coexistence of missions with very different profiles rather than convergence towards an ideal sensor. The limiting factor for machine learning exploitation is neither the data nor the models but ground truth, scarce relative to the volume available and geographically concentrated. And geospatial annotation is a distinct specialty through its georeferencing, its projection systems, the small size of objects and classes defined by administrative convention rather than visual obviousness.
For the sector’s players and economic dynamics, the article on the Earth observation market examines its structure. For how constellations are evolving and what that changes for data access, the article on constellations and NewSpace describes the democratisation under way.
To explore delivery arrangements, supported formats and applicable control mechanisms, see our dedicated page on geospatial data processing. And if you are preparing an annotated corpus for a satellite observation project, let us discuss your project.