
A recent study compared eleven open-source tools computing the same distance metrics on the same masks. Its authors report a result they themselves call alarming: deviations in Hausdorff distance exceeding 100 millimetres and multiple statistically significant differences between tools, demonstrating that statistically significant improvements on the same set of segmentations can be achieved simply by selecting a particular implementation.
In other words, without touching the masks or the model, changing library is enough to significantly improve a publishable result. That observation alone should disqualify the idea that a metric is an objective measurement transferable from one study to another.
This article covers what the field’s metrics actually measure, their respective properties, and the traps in computing and aggregating them. It extends the complete guide to medical image segmentation.
The underlying problem
The most complete reference framework on medical image segmentation metrics offers a severe and useful diagnosis: current metric usage is often ill-informed and does not reflect the underlying domain interest. The reason is an inversion. A metric should be chosen from the clinical question, each question calling for a different indicator. In practice it is chosen by convention, the Dice coefficient being used by default because everyone uses it, and the clinical question never enters the reasoning. That inversion has a direct consequence for an annotation project. Corpus quality control uses the same metrics as model evaluation, and therefore inherits the same defects. A control arrangement built on an unsuitable indicator validates mediocre corpora and rejects sound ones.The two families of medical image segmentation metrics
The field’s indicators fall into two groups measuring different things, and the reference framework treats them separately.Overlap metrics
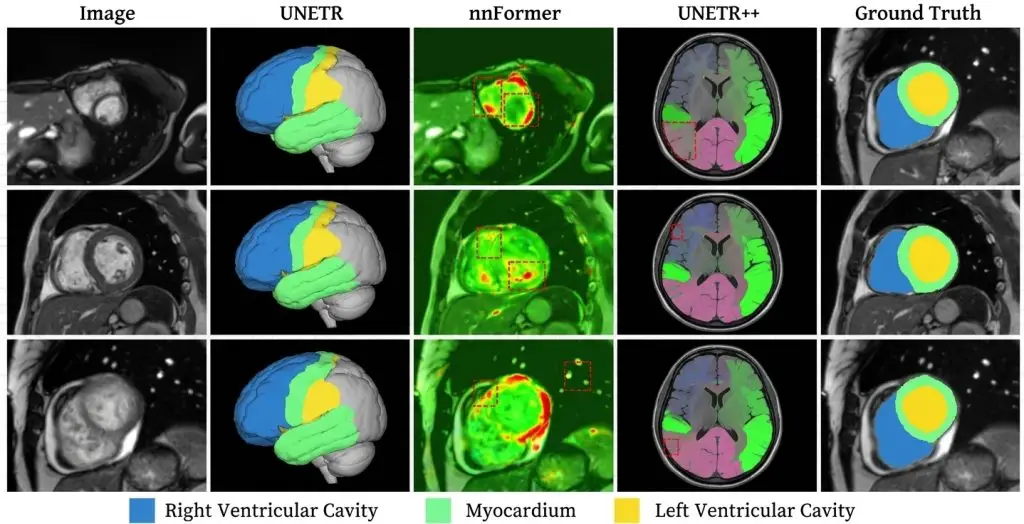
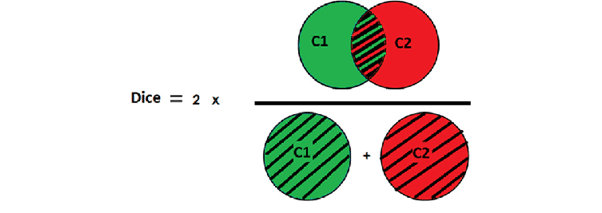
They compare the intersection of two masks against their union or their sum. The Dice coefficient and the Jaccard index are the representatives, and they are mathematically linked: one follows from the other, so reporting both adds no information. Their essential property is being dominated by volume. On a compact structure the core holds most of the voxels, and a boundary error weighs lightly. On a thin structure the boundary is an enormous share of the total, and the same absolute deviation collapses the score. That property has two consequences. Comparing structures of different sizes by overlap is meaningless, the measured gap reflecting geometry as much as difficulty. And a boundary systematically offset by one or two voxels, the commonest annotation error, stays nearly invisible on large structures.Distance metrics
They measure geometric deviation between two surfaces rather than volume overlap. The reference framework lists several: average symmetric surface distance, boundary intersection over union, Hausdorff distance, its 95th percentile, mean average surface distance and normalised surface distance. Their value is capturing what overlap neglects: the location and magnitude of maximum error. A segmentation can post excellent overlap while carrying an aberrant protrusion in one place, and only a distance metric reveals it. Their difficulty is twofold. They are sensitive to extreme values, a single isolated component being enough to degrade raw Hausdorff distance, which explains the common use of its 95th percentile. And their computation is markedly more complex than overlap, which returns us to the implementation problem noted in the introduction.The question that decides
The reference framework states the selection criterion with remarkable clarity, and that formulation beats a list of recommendations. It states that if annotation imprecisions should be compensated for, the default recommendation is the normalised surface distance, and that otherwise the fundamental user preference guiding metric selection is whether errors should be penalised by existence or by distance. That alternative is worth understanding, because it corresponds to a real clinical difference. Penalising by existence means every misclassified voxel counts whatever its position: that is what overlap does, and it suits cases where the quantity sought is a volume. Penalising by distance means a misclassified voxel far from the boundary counts more than one half a millimetre away: that is what distance metrics do, and it suits cases where boundary position matters, treatment planning for instance. A project must therefore answer one question before choosing: is what matters the quantity of material or the position of the limit. The answer determines the family, and it follows from the clinical use covered in the general guide.Tolerance and its role
One metric deserves particular attention because it directly addresses a problem the others ignore: annotation imprecision. Normalised surface distance measures the proportion of boundary lying within a given distance of the reference boundary. It therefore introduces an explicit tolerance, below which a deviation is not counted as an error. That tolerance is what makes it interesting for corpus control. Since the human reference is itself imprecise, demanding exact coincidence is meaningless, and setting a tolerance amounts to stating explicitly from what deviation onwards disagreement is deemed to exist. Choosing that value is a clinical decision rather than a technical one. It should correspond to the deviation below which the difference changes no decision, which means asking the clinical referent. A tolerance chosen arbitrarily makes the metric as conventional as those it replaces.The implementation trap
This point is the article’s most important and the least known among medical image segmentation teams. A synthesis on the subject identifies the origin of the problem: the method used for extracting the segmentation boundary, which is an integral part of all distance-based metrics, is not unified across different tools and can thus influence the resulting metric scores. The mechanism is easy to grasp. Before measuring a distance between two surfaces, what constitutes the surface of a voxel mask must be defined. Several definitions are possible, each producing a slightly different boundary, and the deviation propagates through the computation. To this are added choices about handling anisotropic spacing and the edges of the volume. The deviations observed far exceed what intuition suggests, and the study cited in the introduction concludes that comparisons between published studies are doubtful wherever they do not account for implementation differences. Three practical consequences follow for a project. The computation library must be fixed, documented and versioned alongside the protocol. A performance figure quoted without naming the computation tool is not comparable to another. And any library change mid-project creates a break in the measurement series, which must be flagged rather than absorbed.Aggregation, the second trap
Once metrics are computed per case they must be summarised, and that seemingly innocuous operation changes conclusions. Two aggregation orders coexist. Averaging per case then per class gives each study equal weight. Averaging per class then per case gives each structure equal weight. The two produce different figures as soon as classes are unequally present, and most publications do not state which was used. A second question concerns weighting. An average score across a multi-structure corpus is dominated by the large structures, which mechanically obtain better overlaps. A liver and a millimetric lesion should never appear in the same average. A third concerns dispersion. Reporting a mean without its standard deviation or extreme values masks exactly what matters in quality control: the cases that fail. A corpus averaging 0.90 with a few cases at 0.30 is not equivalent to one uniformly at 0.90, and only the second is usable.The empty case
One particular situation produces absurd medical image segmentation results and occurs in every lesion corpus. Where a structure is absent from a study, the reference is empty. Overlap is then undefined, and depending on the convention adopted the case counts as perfect, as null, or is excluded. All three choices produce very different averages. The problem is worse than it appears, because the right answer depends on the prediction. If the model predicts nothing either, it is right and should be credited. If it predicts a non-existent structure, it is badly wrong and an overlap of zero does not convey the magnitude, since a false positive of ten voxels and one of ten thousand score identically. The convention must therefore be written, and it benefits from being supplemented by a separate indicator counting the cases where an absent structure was predicted and the reverse. Those two counts are more informative than any average over these situations.Structural metrics in medical image segmentation
A third family, less used, answers questions neither overlap nor distance addresses. Instance counting measures how many objects were found, independently of their delineation. It is indispensable as soon as the clinical decision rests on a number, multiple lesions or enumeration. Connectivity measures whether a continuous structure was produced in one piece or fragmented. It is decisive on elongated structures, vessels, airways or fissures, where a fragmented segmentation can post respectable overlap while being unusable for any path analysis. The reference framework accordingly lists a variant of the Dice coefficient designed for tubular structures. Measurement error, finally, compares directly the quantity entering the clinical decision, volume or length. It is the indicator a clinician can interpret most directly, and the one most rarely reported.What corpus quality control requires
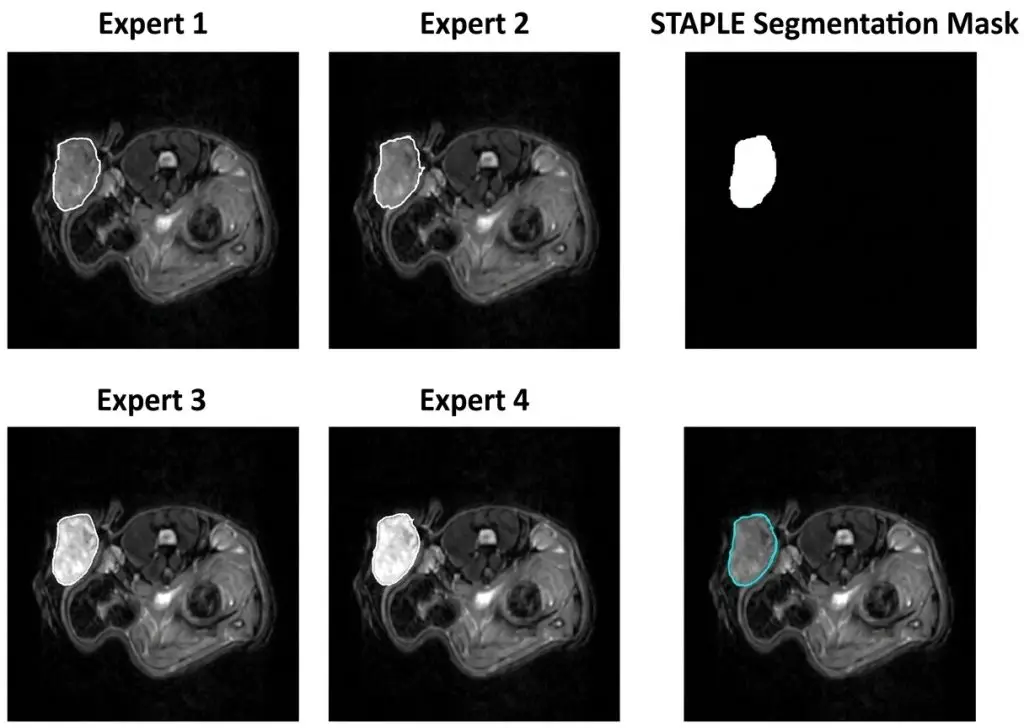
Medical image segmentation metrics serve two distinct uses that must be separated: evaluating a model and controlling a corpus. The second has requirements of its own. The first is measuring agreement between annotators rather than conformity to a reference, since in corpus control no independent truth exists. The same indicators apply, but their interpretation changes: agreement of 0.85 between two annotators does not say they are good, it says they are consistent. The second is reporting per annotator as well as per class, which distinguishes intrinsic difficulty from individual drift. Weak agreement on a class across all annotators signals a protocol problem; weak agreement for one annotator signals a training need. The third is tracking evolution over time. A metric measured once at project end serves nothing; measured per batch, it catches drift while it is still correctable.The acceptance threshold
One question inevitably follows the choice of metrics and rarely receives a reasoned answer: from what value is a deliverable accepted. Three ways of setting that threshold coexist and they are not equivalent. The conventional threshold adopts a value common in the literature, which is convenient and unfounded, since that value was obtained on other structures and other data. The human reference threshold aligns with inter-expert agreement measured at pilot, which is defensible but presupposes that measurement was made. The consequence threshold starts from the deviation below which the clinical decision does not change, which is the soundest and the hardest to establish. The recommended approach combines the latter two. Measure the human ceiling at pilot, ask the clinician from what deviation the difference matters, and set the threshold between the two. A threshold above the human ceiling is unattainable; a threshold far below the consequence threshold pays for precision that serves nothing. One point deserves adding: the threshold must be set per structure rather than globally, for the geometric reasons already set out. A single threshold applied to a liver and a small lesion demands two very different quality levels without saying so.How to report
The form of reporting determines the usefulness of medical image segmentation figures as much as their accuracy. Four elements make a usable report. A pair of metrics, overlap and distance, rather than a single indicator, since they measure different properties and one is never sufficient. A breakdown by class and by condition, never a global figure. Dispersion, standard deviation and worst cases, alongside the mean. And explicit mention of the computation library and its version. A fifth element considerably improves usefulness for a clinical reader: translation into a physical quantity. A boundary deviation expressed in millimetres speaks immediately, where a dimensionless coefficient triggers no intuition. Making that conversion costs little and turns a technical report into decision support.Metrics do not replace looking
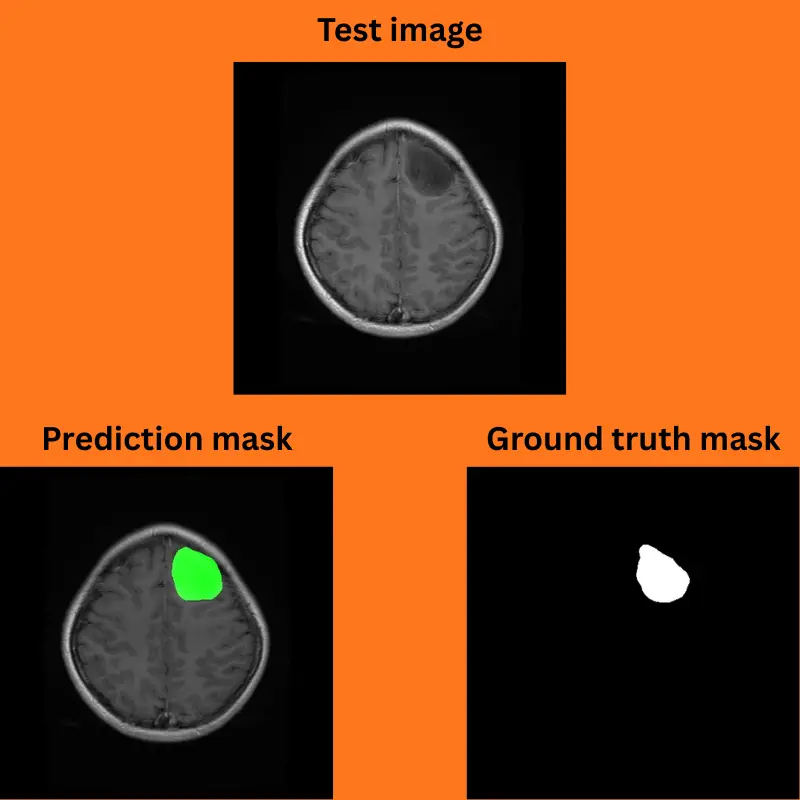
A counterpoint is needed in medical image segmentation, since metric sophistication can become a way of not looking at the images. No combination of indicators detects certain errors. A correctly delineated but mislabelled structure produces zero overlap on two classes with nothing indicating a swap. A segmentation systematically offset in one direction produces respectable figures and a constant error. And a perfect mask on an image whose geometry was altered stays perfect in the computation and wrong in the patient frame. Visual review, in all three planes and on a stratified sample, therefore remains indispensable and is not replaceable. The role of metrics is to say where to look, not to excuse not looking. One simple practice exploits that complementarity: sort cases by metric value and systematically examine the worst, rather than sampling at random. Extreme cases concentrate the information, and they frequently reveal a protocol defect rather than an individual error, which is the most useful thing a control can produce.The reference to compare against
One final point conditions the interpretation of every figure produced. A metric value means something only relative to a reference. Compared with a theoretical ideal, a performance of 0.85 looks mediocre. Compared with agreement between two experts on the same structure, it may be excellent. That ceiling is measured at pilot, structure by structure, and it is the most useful information a project can produce about its own corpus. It determines what is attainable, it allows a performance to be situated honestly, and it prevents contracting a target that human variability makes impossible.Fixing the measurement arrangement at the outset
One last remark concerns timing rather than method, and it avoids a recurring difficulty. The measurement arrangement benefits from being settled before production rather than during. Choosing metrics after seeing the first results exposes a project to an obvious bias: the indicator that flatters the work is the one retained. That bias is rarely conscious and is nearly impossible to correct afterwards, since justifying an indicator change mid-project is always possible. Four elements should therefore be fixed at the outset and recorded: the pair of metrics chosen and its justification by the clinical question, the computation library and its version, the aggregation and empty-case conventions, and the acceptance thresholds per structure. That document fits on one page and its value extends beyond quality control. On a project destined for regulated use, it forms part of the demonstration of data quality, on the same footing as the annotation protocol itself.What to agree with the client
Medical image segmentation metrics are the point where an annotation contract most often becomes disputable, and a short conversation at kickoff prevents most of it. Four things need agreeing in writing. Which indicators define acceptance, with their computation library, since a figure computed two ways is two figures. What the acceptance thresholds are per structure, and what they were derived from. What happens to a batch that falls below threshold, whether it is reworked, partially reworked or accepted with the deviation documented. And who computes the figures, since a provider computing its own acceptance measure is a position that invites challenge and is easily avoided by agreeing that the client recomputes on delivery. That last point is worth proposing rather than conceding. A provider who supplies the masks, states the library and version used, and invites the client to recompute independently, removes the entire category of dispute about whether the numbers were favourably produced. It costs nothing when the work is sound. One addition is worth making explicit: agree what happens if the inter-expert ceiling measured at pilot turns out lower than the threshold initially discussed. That case occurs regularly, and settling in advance that the threshold adjusts to the measured ceiling avoids a renegotiation under pressure later.The most common mistakes
These failures recur often enough across corpus projects that naming them is usually enough to avoid them.- Reporting an overlap coefficient without naming the computation library used.
- Comparing figures from different studies or tools without checking implementations.
- Changing library mid-project without flagging the break in the series.
- Reporting both Dice and Jaccard, which follow from one another.
- Comparing structures of very different sizes by overlap alone.
- Not writing the convention for cases where the structure is absent.
- Not stating the aggregation order used.
- Reporting a mean without dispersion or worst cases.
- Choosing a distance tolerance arbitrarily rather than with the clinician.
- Interpreting a figure without comparing it against the inter-expert ceiling.