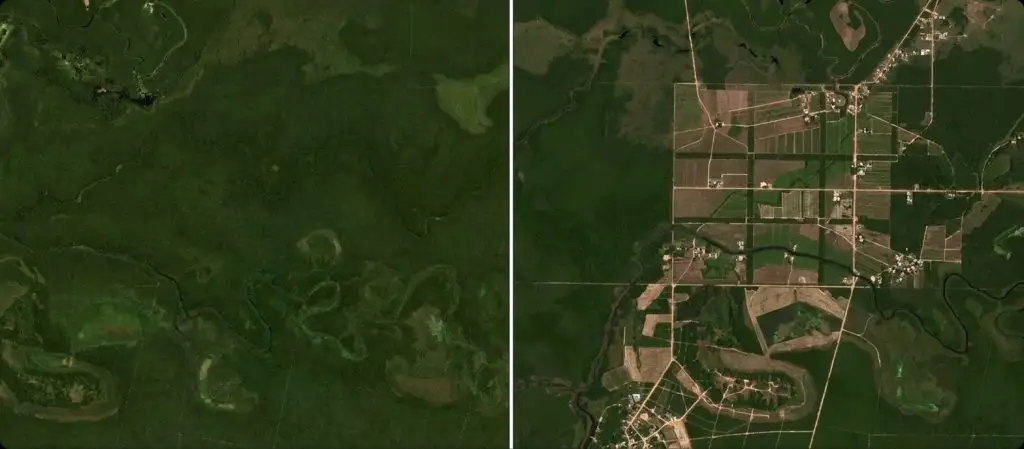

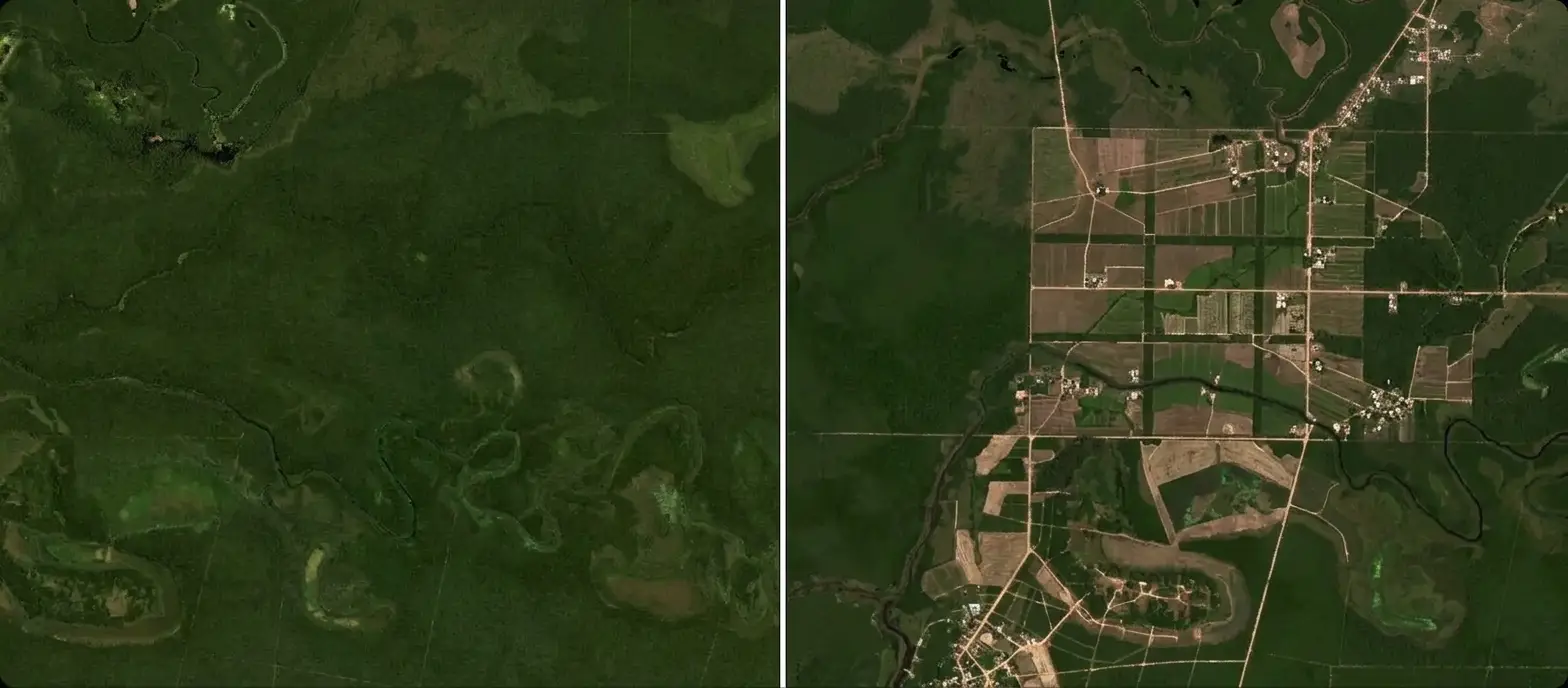
A forest has no clean edge. It thins out progressively, mingles with other formations, closes again after a felling, and that absence of a sharp limit makes monitoring its disappearance far more conventional than one imagines.
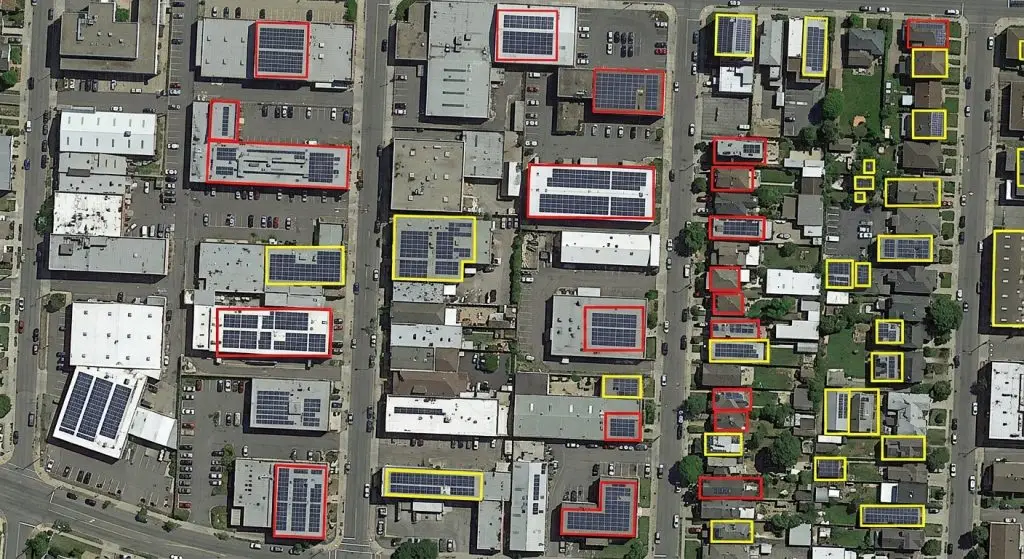
This article sets out those difficulties. It extends the article on solar panels.
The uses that structure the field
Six forestry applications occur in satellite imagery.
Monitoring forest cover across the whole of a territory.
Early alerting on the fellings currently under way.
Verifying no-deforestation commitments made within a supply chain.
Checking compliance with environmental regulation.
Monitoring vegetation recovery after a disturbance.
And estimating the carbon stock that is still standing.
One important practical consequence follows. The second use requires a high acquisition frequency, a late alert being of no further use, which points towards frequent sensors rather than towards high resolution.
What defining a forest requires
Five criteria compose an operational definition in satellite imagery.
A minimum tree canopy cover that must be reached.
A minimum surface to be covered in one piece.
A minimum width, which excludes simple tree lines.
An expected height of the trees once they reach maturity.
And a declared land use, which separates a forest from an orchard.
One important observation follows for a satellite imagery project. Those five criteria vary between institutions and regulations, which means one same parcel is or is not a forest depending on the definition adopted, a decision preceding any annotation.
What loss of cover covers
Five satellite imagery situations produce a visible decrease in cover.
A clear felling followed by an already planned restocking.
A lasting conversion into farmland or else into built-up land.
A fire, after which the vegetation will or will not return.
A slow and progressive health-related dieback.
And a selective felling that thins the stand without removing it.
One important practical consequence follows. The first and the second resemble each other entirely in the year of the felling, which makes the distinction impossible on a single image and requires waiting for the following acquisitions to settle it.
What the threshold imposes
Four decisions structure change detection in satellite imagery.
The minimum cover loss that will be considered a change.
The minimum surface adopted for a single disturbed zone.
The duration beyond which a loss is deemed lasting.
And the treatment given to partial or progressive losses.
One observation follows. The first decision commands every published figure, two studies using different thresholds producing incomparable deforested surfaces over the same territory.
What the season changes
Five seasonal effects complicate the comparison in satellite imagery.
A broadleaf forest loses all its cover each winter.
A drought modifies the cover’s colour without any loss of surface.
A temporary flood comes to mask the whole understorey.
A rapid regrowth closes a whole gap within a single season.
And cloud cover varies very strongly from month to month.
One important practical consequence follows for a satellite imagery project. The last effect is decisive in tropical zones, a rainy season making optical imagery unusable for months, which explains the recourse to radar over territories where surveillance must stay continuous.
What radar brings here
Four advantages justify this satellite imagery sensor on this subject.
An acquisition wholly insensitive to cloud cover.
An observation staying possible by night as much as by day.
A sensitivity to the cover’s structure rather than to its colour alone.
And a temporal regularity optical imagery never attains.
Three limits accompany it in satellite imagery.
A radar image reads nothing like an ordinary photograph.
The relief produces distortions that then have to be corrected.
And radar annotation requires a competence that is rare and long to acquire.
What the annotation must produce
Four annotation forms occur in satellite imagery according to the intended use.
A forest cover mask established at a given date.
A polygon delimiting each observed loss zone.
A cause class assigned to each one of the disturbances.
And an estimated date for each observed event.
One important observation follows. The third form is the most useful and the most difficult, assigning a cause resting on contextual clues rather than on the appearance of the disturbed zone itself.
What the reference requires here
Four sources establish a ground truth in satellite imagery.
Field surveys, perfectly exact but very limited in extent.
The administrative felling permits actually issued.
Higher-resolution imagery acquired over the same areas.
And interpretation conducted by an experienced forestry expert.
One practical consequence follows for a satellite imagery project. The second source covers, by construction, only declared fellings, which makes it unusable for evaluating detection of illegal fellings, precisely the use motivating many projects.
What assigning a cause presupposes
Five satellite imagery clues direct the determination of a cause.
The shape of the disturbed zone, plainly regular or irregular.
Proximity to a road or to any other existing access.
The presence of a crop or a construction visible on the following images.
The trace of a front advancing from an existing edge.
And the regulatory or tenure context proper to the parcel.
One important practical consequence follows. The third clue is the most conclusive and the most delayed, the use that follows a felling designating its cause with certainty, which makes assignment retrospective work rather than an analysis of the moment.
What the measurement must reflect
Five indicators describe such a satellite imagery system’s performance.
The proportion of losses detected, systematically broken down by surface.
The delay elapsed between the event and its effective detection.
The false alert rate, systematically set against seasonal causes.
The accuracy of the cause finally assigned.
And the performance obtained on partial losses rather than on clear fellings.
One important observation follows. The second indicator outweighs all the others for an alerting use, an accurate but late detection having no operational value at all on a site already finished.
What recovery requires monitoring
Four observations compose a monitoring of vegetation recovery in satellite imagery.
The delay elapsed before a detectable cover appears.
The speed at which the observed gap closes again.
The exact composition of the stand growing back.
And whether or not cover returns to the level that pre-existed.
One important observation follows for a satellite imagery project. The third observation exceeds what the image alone permits, regrowth as a single-species plantation being poorly distinguished from natural regeneration at a distance, which makes this information dependent on a field survey or on knowledge of local practices.
What the edge imposes as a convention
Four situations make a stand’s limit ambiguous in satellite imagery.
A progressive transition towards heath or towards grassland.
An open woodland whose cover sits precisely around the threshold.
A particularly wide hedgerow approaching the definition of a forest.
And a fringe of vegetation reclaiming an abandoned parcel.
One important practical consequence follows for a satellite imagery project. The second situation concentrates most of the disagreement between operators, a cover oscillating around the adopted threshold tipping from one class into the other according to judgement, which makes a numerical criterion preferable to a qualitative instruction.
What the time series brings
Four satellite imagery insights follow from regular acquisitions over one area.
An event’s date, bracketed between two successive passes.
The distinction between a seasonal variation and a lasting loss.
The pace of a deforestation front as it steadily advances.
And vegetation recovery, observable across the following years.
One important observation follows. The second insight is obtained in no other way, a cover absent at one date being able to reflect a season or a felling, a distinction only comparison with earlier years permits settling.
What the corpus must cover here
Five axes structure a forest monitoring dataset in satellite imagery.
The types of formation actually covered, from dense stands to open woodland.
The climatic regions handled, whose growth rhythms differ considerably.
The seasons covered, which entirely modify broadleaf cover.
The causes of disturbance, felling, fire and conversion included.
And the edge zones, where most of the operator disagreement concentrates.
One important observation follows. The fourth axis demands particular effort, fires and diebacks being far rarer than fellings in a random sample, which produces a corpus that learns above all to recognise ordinary forestry operations.
What this work’s throughput presupposes
Four factors determine the time spent per tile in satellite imagery.
The total length of edges to delimit within the scene.
The number of dates to compare in order to settle a cause.
The proportion of transition zones encountered.
And whether or not a cause assignment is required for each disturbance.
One important practical consequence follows. The second factor separates this subject from the others in the cluster, one same area having to be examined across several successive acquisitions, which multiplies the time by a factor costings established on a single date systematically ignore.
What the annotator must know here
Five kinds of knowledge condition correct work on this subject.
The definition and threshold adopted, applied without the least interpretation.
The appearance of a recent felling compared with that of a young plantation.
The seasonal variations proper to the formations encountered.
The contextual clues directing the assignment of a cause.
And the treatment rule applied to zones under cloud cover.
One important observation follows for a satellite imagery project. The third kind does not transfer from one territory to another, a tropical forest, a boreal forest and a temperate oak wood presenting entirely different rhythms, which makes training dependent on the area handled rather than on the forestry domain in general.
What the delivery format requires here
Four choices condition the client’s use of the satellite imagery result.
The division finally adopted, loss polygon or cover mask by date.
The date assigned to each disturbance along with its uncertainty.
The associated cause, where it could be determined.
And the threshold employed, systematically stated with the published surfaces.
One important practical consequence follows for a satellite imagery project. The last choice protects the client as much as the provider, a surface published without its threshold becoming incomparable and sometimes contested, whereas the same surface accompanied by its calculation rule is defended without difficulty.
What the subject’s stakes add
Four requirements accompany a result intended to be relied on against a third party.
Full traceability of the method employed and of all its parameters.
Documentation of the cases set aside and of the reason for it.
A possibility of replaying the whole calculation on the same images.
And a clear expression of the uncertainty attached to the surfaces.
One important observation follows for a satellite imagery project. Those four requirements exceed those of an ordinary project, a deforestation figure being able to found a sanction, a certification or a public controversy, which brings this field closer to regulated contexts than to the cluster’s other subjects.
What the first batch must establish
Four results justify a satellite imagery trial batch before production.
The disagreement rate between two operators on the edge zones.
The proportion of disturbances whose cause stays undetermined.
The number of dates genuinely needed to settle a case.
And the gap between the surfaces obtained and an existing reference.
One important practical consequence follows for a satellite imagery project. The third result conditions the whole costing, a project assuming two dates and requiring four seeing its cost double, which makes this measurement preferable to any estimate made at proposal stage.
What pre-annotation permits here
Three uses appreciably lighten satellite imagery work on this subject.
An automatic flagging of zones whose reflectance has changed between two dates.
An outline proposal on well-contrasted clear fellings.
And a provisional ranking of the changes by their magnitude.
Two caveats accompany it in satellite imagery.
A mere seasonal change triggers the same flag as a real felling.
And assigning a cause stays entirely beyond the reach of these tools.
What the provider brings here
Four contributions distinguish a forestry engagement conducted on satellite imagery.
A definition and a threshold aligned on the client’s own reference.
An annotation conducted across several successive dates rather than on an isolated image.
Deliberate coverage of the rarest causes of disturbance.
And annotators trained in radar reading where the context requires it.
One important practical consequence follows. The last contribution stays rare on the market, reading a radar image demanding several weeks of learning, which considerably narrows the number of providers able to handle territories where cloud cover forbids optical imagery.
Approaching a forest monitoring project
Five questions scope such a satellite imagery project.
Which definition of forest applies. It changes everything.
What loss threshold constitutes a change. It commands the figures.
Is a cause to be assigned. That is the difficult part.
Does detection delay matter. It directs the choice of sensor.
And is cloud cover an obstacle. Radar then becomes necessary.
Those five answers determine the project’s feasibility. Asking them before acquisition avoids figures nobody will be able to compare with those of another study.
The question that frames the project
One question determines the arrangement needed in satellite imagery.
Does the result serve to alert or to account.
An alert, flagging a felling under way, requires a high frequency, a short delay and tolerates a false alert rate that human verification absorbs.
An accounting, an annual balance or verification of a commitment, requires a definition aligned on a reference, a documented threshold and reliable cause assignment.
That question belongs to the use and not to technique, it is asked before acquisition, and it separates two projects whose sensor and rhythm bear no comparison.
Three decisions before producing
Three decisions commit a forest monitoring project in satellite imagery.
Adopting the client’s definition of forest rather than a definition of one’s own.
Fixing the cover loss threshold, which commands every published figure.
And providing for observation across several dates, the cause not reading on one image.
Those three decisions cost one meeting, they precede acquisition, and their absence produces figures nobody will be able to compare with those of another study.
Three checks on a forest corpus
Three checks qualify a monitoring dataset in satellite imagery.
The definition of forest finally adopted and its alignment on the client’s.
The loss threshold applied, expressed in figures rather than in judgement.
And the actual presence of varied disturbance causes among the annotated examples.
Those three checks are each asked in one question, they require no forestry competence, and their absence indicates a corpus whose surfaces will compare with no other study.
What this chapter teaches
One cross-cutting observation deserves closing this examination.
A loss of cover is observed, its meaning is decided.
Three findings compose it.
A planned felling and a lasting conversion resemble each other entirely in the year of the felling.
Two studies using different thresholds produce incomparable surfaces.
And a felling permit covers only declared fellings.
That finding extends the preceding chapter, a natural environment offering none of the regularities that eased detection of manufactured objects.
What this chapter leaves to the next
A farm field changes appearance every month without anything being lost.
Three questions stay open in satellite imagery.
How to delimit parcels whose boundaries are not physically marked.
What a succession of crops imposes on monitoring one same surface.
And how a computed index sometimes replaces a visual annotation.
Those three questions belong to agriculture seen from above, which constitutes the subject of the following chapter.
Why radar competence is worth building
One observation about capability belongs at the close of this chapter.
Radar reading is the narrowest bottleneck in this whole field.
Three reasons follow in satellite imagery.
The territories with the most deforestation are also the cloudiest.
Optical imagery is unusable there for months at a time.
And few annotation teams have anyone who reads radar fluently.
One important practical consequence follows for a satellite imagery provider. Building this competence takes weeks rather than years and opens work that competitors decline outright, since a client with a tropical monitoring obligation cannot wait for clear skies and will pay for the only team able to deliver through the wet season.
What makes this subject harder than it looks
Four traits separate it from the cluster’s other subjects.
The object of interest has no sharp boundary anywhere.
The same appearance can mean a routine operation or a permanent loss.
The answer usually requires several dates rather than one.
And the figures produced may be relied on against a third party.
One important observation follows for a satellite imagery project. Those four traits compound, which is why costings built on the cluster’s earlier subjects understate this one substantially, and why a client who has run a building or panel inventory should be told plainly that this work behaves differently.
Common mistakes
These failures recur often enough that naming them is usually enough to avoid them.
- Using a definition of forest different from the client’s.
- Concluding to deforestation on a single image.
- Comparing surfaces obtained with different thresholds.
- Evaluating illegal felling detection against felling permits.
- Neglecting seasonal regrowth as a source of false alerts.
- Ignoring cloud cover when planning acquisitions.
- Measuring performance without measuring detection delay.
- Treating a selective felling as an absence of change.
- Assigning a cause with no contextual clues.
- Comparing two dates from different seasons on broadleaves.
What to take away
Deforestation monitoring rests on definitions as much as on observations.
Three readings emerge. A planned felling and a lasting conversion resemble each other entirely in the year of the felling, which makes the distinction impossible on a single image and requires waiting for the following acquisitions to settle it. Two studies using different loss thresholds produce incomparable deforested surfaces over the same territory, which makes the threshold a parameter to align on the client’s before any production. And an administrative permit covers, by construction, only declared fellings, which makes it unusable for evaluating detection of illegal fellings, precisely the use motivating many projects.
For crop observation, the article on agriculture seen from above details the approach. For sensors, the article on multispectral imagery sets it out.
To explore delivery arrangements, supported formats and applicable control mechanisms, see our dedicated page on annotation for geospatial. And if you are preparing a forest monitoring project, let us discuss your need.