
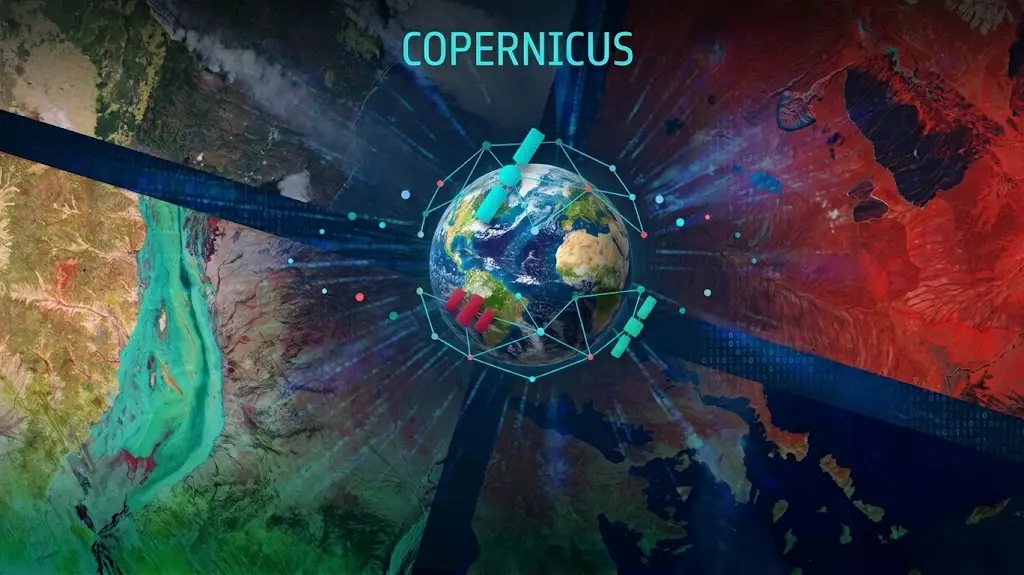
The official platform describes the programme in a sentence that sets out its scope: Copernicus is the European Union’s flagship Earth observation initiative, designed to provide valuable information services to citizens and organizations across the EU, and it utilises a combination of satellite Earth observation and in-situ non-space data to monitor and understand our planet and its environment.
The opening article of this series showed the scale of the resource and its free availability. This one describes its organisation, its access arrangements and what a project can actually draw from it. It extends the article on Earth observation and insurance.
The structure of the Copernicus programme
Three components articulate and distinguishing them avoids the commonest confusions.
The space component of this Earth observation programme comprises dedicated satellites, whose missions cover radar, optical, altimetry and atmospheric composition, each meeting different needs the opening article described by sensor family.
The in situ component comprises measurements on land, at sea and in the atmosphere, without which the validation described in the climate article would be impossible.
The services component transforms those measurements into thematic products for specific uses. Six domains are covered: the atmosphere, the marine environment, land surfaces, climate change, emergency management and security.
That third component is the least known and yet often the most directly useful. A project seeking a land cover map or an air quality indicator finds a ready-made product there rather than images to process.
The Earth observation data access platform
Access has changed in nature and that evolution deserves understanding.
The historical download service has been replaced by a platform which, according to its official documentation, provides a range of application programming interfaces, including catalog access, product download, visualization, and processing services.
That formulation contains the essence of the change. The platform no longer merely distributes files; it offers to process the data where it sits.
The same source specifies this is a service to benefit institutional users, research and the commercial sector as well as every citizen, confirming the absence of access restriction the opening article noted.
Four access routes coexist and the choice between them largely determines a project’s processing cost.
The four Earth observation access routes
Each suits a particular Earth observation use, and using them out of place produces wasted work.
The online browser suits exploration, checking availability over an area and visual inspection. It is the starting point recommended in the opening article.
Catalogue interfaces allow data to be searched by criteria. The documentation specifies that the catalogue is a web service that can be queried through 4 different REST protocols, which leaves the choice of whichever suits a given environment.
Processing interfaces allow a computed result to be obtained rather than a raw image, a mechanism deserving the development that follows.
And object storage allows high-performance parallel access, the documentation describing it as suited to third-party applications requiring scalability.
The change of paradigm
This mechanism transforms the economics of an Earth observation project.
A technical note published on the platform explains it through an example: you can bypass downloading full granules and access only the pixels that you are interested in; for example, to examine the vegetation index signature for a specific field, you would no longer have to download a full granule with all the spectral bands it contains, but only the analysis-ready index product, all the processing being done in the cloud.
That difference in volume is considerable. A complete scene weighs several hundred megabytes to several gigabytes; the index computed over a field weighs a few kilobytes.
The same principle underlies another interface, whose documentation states that the processing is automatically scaled on the cloud infrastructure that also hosts the data, allowing for a range of use cases from explorative research to large-scale production of derived maps and information.
Three consequences follow for a data project. The local storage need collapses, removing the principal material barrier. Setup time falls from weeks to hours. And reproducibility improves, a processing step described by a request being easier to replay than a local chain.
Where the paid tier begins
Free availability is sometimes presented without nuance.
An infrastructure operator of the platform states that all functionalities are available free of charge for general users with some predefined quotas, and that if a user wants to download or process data on a large scale, commercial conditions apply.
That distinction is reasonable and it carries a practical consequence. An exploratory project, a demonstration or research work remain free; volume production presupposes an infrastructure budget.
Three practical recommendations follow. Estimate processing volume at scoping rather than after exhausting a quota. Design the chain to minimise redundant computation, a poorly designed process consuming several times the resource needed. And distinguish the exploratory phase, free, from the production phase, budgeted.
Two metadata models
This distinction affects the quality of the information available.
The catalogue documentation contrasts two approaches: the interface based on the older protocol is self-describing and exposes its data model in the metadata, but that data model is not standardized; the interface based on the specification developed by the Earth observation community aims by contrast to provide the highest quality metadata.
That technical precision has practical reach. A project seeking to filter finely, by cloud cover, acquisition geometry or quality, gains from using the second, whose model is standardised and therefore comparable across sources.
A further consequence deserves stating. That standardisation allows different catalogues to be queried the same way, which considerably simplifies a project combining several suppliers, a difficulty the constellations article flagged.
Importing your own data
This little-known possibility directly interests an annotation project.
The documentation describes an interface allowing you to import your own data and access it just like any other data, provided it is stored in a raster format optimised for remote access on an object storage bucket.
That import capability has three uses for a data project. It allows an annotated corpus to be overlaid on the source imagery in the same environment, which eases checking. It allows a result to be delivered in a form directly usable by the client in their habitual environment. And it allows commercial data to be combined with the open resource without changing tooling.
That third use is the most commercially interesting. It places the provider inside the client’s working environment rather than in a separate delivery channel, which reduces the integration friction the market article flagged.
Traceability
This capability matches a requirement every cluster in this series has raised.
The platform offers a traceability interface, mentioned in its documentation alongside the access and production interfaces.
Its interest is direct and immediate for a serious project. The climate article showed provenance documentation and version control are the field’s standard; the security article showed traceability becomes contractual there. Having a native mechanism rather than a hand-maintained register appreciably reduces the cost of that requirement.
One simple recommendation follows. A project gains from using that mechanism from the outset rather than reconstructing provenance afterwards, a principle earlier clusters established in general form: documentation is produced during, never after.
The Earth observation thematic services in detail
They are the most underused part of the programme.
The atmosphere service produces analyses and forecasts of air composition, including the pollutants and greenhouse gases the climate article discussed.
The marine service produces analyses of ocean state, temperature, currents, level and ice conditions.
The land surface service produces land cover maps, vegetation indicators and thematic layers on built-up areas and hydrography. It is the one intersecting most directly with annotation needs.
The climate service produces the long-term records whose requirements the climate article detailed.
The emergency management service produces rapid mapping after an event, a capability matching the uses described in the security and insurance articles.
And the security service supports border and maritime surveillance, with the usage constraints the sovereignty article set out.
One recommendation runs across those six domains. Checking whether a product exists before developing a processing chain avoids sometimes considerable work, and that check takes an hour.
The Earth observation missions and what they permit
The choice between them determines what a project can observe.
The main families deserve situating. Radar missions provide acquisition independent of weather and illumination, a property the insurance and security articles showed decisive. They serve water surface monitoring, ground deformation and moisture.
Multispectral optical missions provide the most used surface imagery, with a revisit of a few days and bands allowing the vegetation indices discussed in the insurance article to be computed.
Low resolution wide-swath missions provide daily coverage, suited to monitoring extensive and fast phenomena rather than local analysis.
Altimetry missions measure heights, sea level and ice surface topography notably.
And atmospheric missions measure air composition, with the precision the climate article documented.
One trade-off runs across those families and it matches the one set out in the opening article. Wide coverage comes with coarse resolution, and the reverse. Choosing the mission suited to the size of the object observed is a project’s first decision, before any algorithm choice.
Earth observation quality limits worth knowing
This dimension affects exploitation and it is rarely addressed.
Earth observation products carry per-pixel quality indicators, and ignoring them produces wrong analyses across entire areas.
Four situations show it. Cloud and shadow masks, whose accuracy is imperfect, an undetected thin cloud altering values with nothing signalling it. Atmospheric correction, whose quality varies with conditions and viewing angle, introducing variability between acquisitions of the same place. Overlap zones between orbits, where two nearby acquisitions may differ slightly. And swath edge artefacts, whose geometry differs from the image centre.
Those four situations share a property earlier clusters described: they produce plausible wrong values, undetectable without examining the associated indicators.
The recommendation that follows is simple and little followed. Systematically use the quality masks supplied with products, and document their use in the corpus description, which will later allow a performance figure to be explained rather than endured.
Where to start concretely
Five steps allow the resource to be assessed with no commitment. They take a few days.
Create an account and explore the online browser over a familiar area, to appreciate visually what the resolution permits.
Verify actual availability over the target area and period, filtering on cloud cover, which answers the most decisive question of an optical project.
Examine the thematic services before processing any imagery, an existing product possibly meeting the need without development.
Try a processing interface on a restricted area, to measure the gap between downloading and the remote computation described above.
And estimate the processing volume of a full deployment, to situate the project relative to the free quotas.
Combining open and commercial Earth observation sources
This frequent configuration is the commonest arrangement of a serious project.
The open resource and the commercial offering do not compete head on, as the market article showed. Three divisions occur in practice.
Open for systematic coverage and commercial for occasional depth. Regular monitoring rests on the free resource, and a very high resolution acquisition is ordered when an event justifies it.
Open for history and commercial for currency. The free archive supplies the temporal depth recent constellations lack, and commercial supplies freshness.
And open for training and commercial for exploitation. A model developed on free data can then be applied to higher resolution commercial imagery, subject to the transferability the opening article flagged as limited.
That third division demands the greatest caution. A model trained at one resolution and applied at another changes conditions, which requires re-evaluation rather than direct transfer.
What Copernicus does not provide
Without these limits, an Earth observation project is badly sized.
Very high resolution is not there. The resolutions available suit analysis of canopy, water bodies or large structures, not the characterisation of an individual building, a need the insurance article described and which calls for a commercial source.
Extreme responsiveness is not there either. Availability delays suit regular monitoring rather than a response in hours, a subject the near real time article examines.
Tasked acquisition does not exist. The satellites follow a systematic plan and a user cannot order a capture, a constraint the constellations article described as a commercial service.
And above all, ground truth is not there. That is the fundamental limit the opening article set out and which nothing in the richness of this resource compensates for.
What the open resource changes for a client
This symmetry changes the nature of a proposal in Earth observation.
A client holds the same resource as their provider. That symmetry is unusual and it has three effects.
It forbids charging for data access, which shifts value towards processing and annotation, the mechanism the market article described.
It makes the work verifiable. A client can check a result against their own data, which is both a demand for rigour and an opportunity for credibility.
And it permits demonstration at no cost. A provider can produce an example over the prospect’s own area before any commitment, which appreciably shortens a sales cycle.
That third effect is probably the most exploitable. A demonstration on the prospect’s real data, produced in a few hours thanks to the remote processing described above, carries a conviction no presentation replaces, and its marginal cost is an afternoon.
What this means for a provider
Four practical consequences follow.
The first is that mastering these interfaces is a differentiating competence. Many teams still download complete scenes for want of knowing the remote processing mechanisms, which multiplies their costs and their delays.
The second is that the ability to deliver into the client’s environment, through the import route described above, removes a real friction and distinguishes an offering.
The third is that native traceability allows a documentary requirement to be met at lower cost, which makes a methodological promise credible without adding workload.
And the fourth is that the limits set out above delimit the market precisely. The free resource covers imagery; it covers neither very high resolution, nor tasking, nor ground truth. An offering is built on those three gaps.
The archive as the real Earth observation asset
One property of this Earth observation resource deserves separating from the rest, because it is the hardest thing for any competitor to replicate.
The missions have been acquiring systematically for years, which produces something no commercial operator launched recently can offer: a consistent record of the same places under comparable conditions over an extended period.
Three uses depend entirely on that depth. Trend analysis, which the climate article showed requires long series. Catastrophe model calibration, which the insurance article showed rests on the footprints of past events. And baseline establishment, where a change is meaningful only against a documented prior state.
One consequence follows for how a project is scoped. Questions requiring history should be built on the open archive regardless of what a commercial supplier offers today, because that supplier’s archive begins when its satellites launched.
A second consequence concerns annotation. Corpora built on this archive retain their value indefinitely, since the underlying imagery does not expire and remains freely accessible. That is unusual: in most domains an annotated corpus decays as its source data becomes obsolete, and here it does not.
Common errors of reading
These misreadings recur often enough that naming them is usually enough to avoid them.
- Downloading complete scenes where remote processing suffices.
- Using a non-standardised catalogue protocol for fine filtering.
- Ignoring the thematic services and reprocessing imagery unnecessarily.
- Discovering the free quotas after sizing a production run.
- Expecting very high resolution from a medium resolution resource.
- Assuming an acquisition can be ordered over an area.
- Reconstructing provenance afterwards rather than using native traceability.
- Neglecting cloud cover verification before sizing a project.
- Delivering a result in a format foreign to the client’s environment.
- Confusing the richness of the resource with the availability of ground truth.
- Ignoring the quality masks supplied with the products.
- Choosing a mission whose resolution does not suit the size of the object observed.
Why this resource shapes the whole sector
A closing observation explains why a programme discussed as infrastructure determines commercial reality across this series.
Every article in this cluster has run into the same fact. The market article found free data exerting persistent pricing pressure. The constellations article found commercial operators moving up into products because selling comparable imagery had become difficult. The insurance article found parametric triggers built on measurements this programme supplies. The climate article found two-thirds of essential variables measured from space, largely through public missions.
Those are not four observations. They are one structural fact seen from four angles: a public resource of this scale, offered freely, reorganises everything downstream of it.
Two consequences hold generally. Nobody competes on access, so competition happens on interpretation. And interpretation requires ground truth, which no amount of imagery supplies.
That is the whole argument of this series compressed into two sentences, and this programme is the reason it holds. A sector where the raw material is abundant and free is a sector where the scarce input is knowing what the raw material shows, which is exactly the work of building and documenting annotated corpora.
What to take away
Copernicus is the European Union’s flagship Earth observation initiative, combining satellite observation and in situ data, and its access has changed in nature with the move from a download service to a processing platform.
Three readings emerge. The most transformative mechanism allows only the pixels of interest to be accessed rather than complete granules, processing running on the infrastructure hosting the data, which turns a several-gigabyte need into a few kilobytes and removes a project’s principal material barrier. Free availability comes with predefined quotas beyond which commercial conditions apply, which requires estimating processing volume at scoping rather than afterwards. And the resource provides neither very high resolution, nor tasked acquisition, nor ground truth, those three gaps delimiting precisely the market for complementary services.
For the difficulty this resource does not solve, the article on AI and Earth observation examines the annotated data bottleneck. For this programme’s strategic position, the article on European sovereignty covers the institutional question.
To explore delivery arrangements, supported formats and applicable control mechanisms, see our dedicated page on geospatial data processing. And if you need to build ground truth on Copernicus data, let us discuss your project.