
A reference publication in remote sensing states a fact most projects overlook: the mapped area of deforestation, forest harvest or any other land change is likely to be different from the actual area because of map classification error, even if the change map has a high overall accuracy.
A map can therefore report an excellent accuracy figure and supply a wrong area estimate. This article sets out why, what the field’s good practices recommend, and what that implies for building a reference corpus. It extends the article on Earth observation startups.
Why counting pixels is not enough in Earth observation
One methodological error dominates the field and the literature names it explicitly.
Good practice guidance cautions against the common practice of estimating area by pixel counting, meaning summing the number of pixels assigned to a class on the map and multiplying by the areal extent of a pixel.
The reason is simple to state. A classification errs in both directions: it assigns to a class pixels that do not belong to it, and it misses pixels that do. Those two errors do not cancel, and their balance biases the area estimate.
The recommended method is to estimate area from the reference classification and to use the information contained in the error matrix to improve the estimator’s precision.
That recommendation has a direct consequence for a project. The area estimate is not read off the map; it is computed from a reference sample, which makes building that sample a central operation rather than an incidental one.
The established Earth observation validation method
The literature enumerates precisely what is expected, and that list is directly usable as a specification.
Five elements read out of that, and the absence of any one of them leaves the assessment incomplete.
The same authors add a further requirement: mapped areas should be adjusted to eliminate bias attributable to map classification error, and these error-adjusted area estimates should be accompanied by confidence intervals to quantify the sampling variability of the estimated area.
That requirement matches exactly the one the climate article documented: uncertainty is characterised rather than ignored.
What research finds about actual Earth observation practice
The gap between recommendation and practice is documented, which is worth knowing before assessing any product.
The same reference synthesis notes that mapping results are rarely perfect, since placing spatially and categorically continuous conditions into discrete classes may result in confusion at the categorical transitions, and error can also result from the change mapping process, the data used, and analyst biases.
Three sources of error are named there and they are worth separating. The discretisation itself, which produces irreducible confusion at boundaries. The processing chain, whose defects the errors articles in earlier clusters described. And analyst bias, which the segmentation cluster documented as inter-observer variability.
That third source deserves emphasis in this context. It affects not only the product but the reference used to judge it, a circularity the section below addresses.
The three Earth observation accuracy measures
One technical distinction deserves stating because misunderstanding it produces systematic errors of interpretation.
Overall accuracy gives the proportion of correctly classified cases across all categories. It is the figure most often announced and the least informative.
User’s accuracy gives, for a class on the map, the proportion of cases actually belonging to that class. It answers the map reader’s question: where it shows forest, is there forest.
Producer’s accuracy gives, for a class on the ground, the proportion correctly identified on the map. It answers the inverse question: were the existing forests mapped.
Those last two can differ considerably for the same class, and a map can show excellent user’s accuracy on a rare class while missing most of it.
One practical consequence follows. A single overall accuracy figure masks very uneven performance between classes, and the opening article flagged that rare classes are systematically the worst served.
The sampling design
One methodological requirement conditions the validity of any assessment, and the literature states it without qualification.
Inclusion probabilities are the basis of the accuracy and area estimates, so where they are not known, the probabilistic basis for inference is forfeited. The authors indicate it is difficult to envisage a circumstance where a departure from probability sampling would be acceptable for a scientifically rigorous assessment.
That formulation is categorical and it carries considerable practical reach.
Three consequences follow. A reference sample built by choosing convenient areas supports no inference whatever its size. A sample built from whatever existing data happens to be available suffers the same defect where availability is not independent of what is being measured. And a sample extended during collection must be extended under a design that preserves inclusion probabilities.
Stratified random sampling has a useful property here: increasing or decreasing sample size after collection has begun is readily accommodated, which offers appreciable operational flexibility.
The quality of the Earth observation reference
A circular difficulty deserves setting out because it is rarely addressed.
An assessment compares a map against a reference, and that reference contains errors of its own. The literature acknowledges this, noting that estimation should ideally be robust against analyst biases and imperfect reference data.
Three sources of error affect a reference. Interpretation, an analyst being able to err or hesitate. Class definition, discretisation producing confusion at transitions as noted above. And dating, a field survey and an image not necessarily being contemporaneous.
Two practical consequences follow. The quality of the reference bounds measurable accuracy, a model being unable to appear better than the reference judging it. And disagreement between annotators on a sample provides an estimate of that bound, a measurement the AI article recommended and whose direct use this is.
What Earth observation validation requires in practice
Five operations structure a rigorous assessment and their order matters.
Define the sampling design before collection, including stratification where rare classes are involved, since it conditions the validity of everything that follows.
Define the response design, meaning what constitutes the reference for each sampled unit, at what spatial support and by what interpretation rules.
Collect the reference according to that design, preserving the inclusion probabilities.
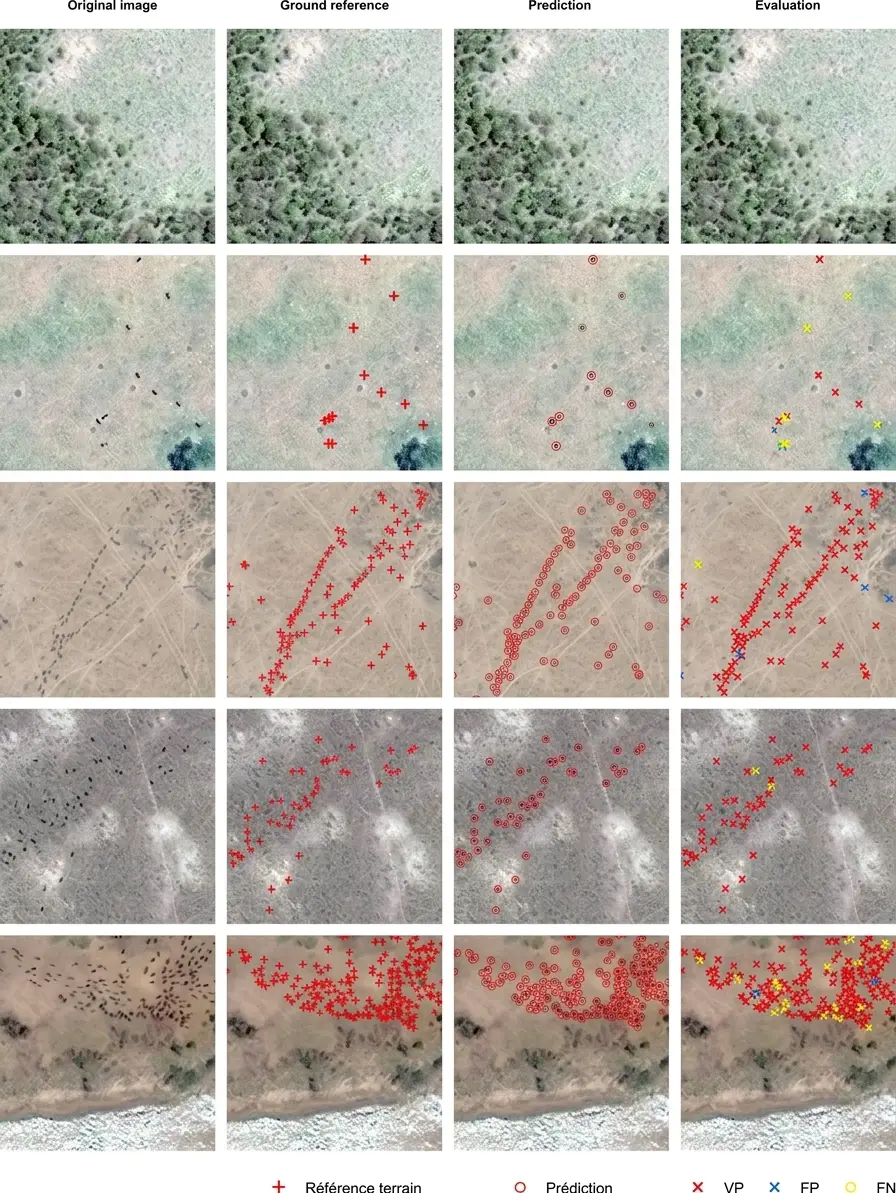
Compute the error matrix and the accuracy measures using estimators corresponding to the design, a correspondence the literature identifies as frequently neglected.
And adjust the areas and compute confidence intervals, which the recommendation cited above treats as part of the assessment rather than as an optional extra.
What this represents as work
Sizing matters because this line is regularly underestimated in a budget.
A rigorous validation requires hundreds to thousands of reference points depending on the number of classes and the precision sought.
Three factors determine that volume. The number of classes, each needing sufficient numbers. The rarity of classes, one covering a small proportion of the territory requiring stratification to be represented at all. And the precision targeted, a narrow confidence interval requiring more observations.
One practical consequence follows. The evaluation corpus represents a significant share of a project’s effort, and the AI article recommended concentrating expert effort there rather than spreading it evenly.
Validating continuous Earth observation products
One family of products falls outside the framework described and it deserves separate treatment.
Biomass estimates, surface temperature, soil moisture and vegetation indices are continuous quantities rather than classes, which makes an error matrix inapplicable.
Their validation rests on different measures: bias, meaning systematic deviation from the reference; dispersion, meaning the spread of errors; and the relationship between the two across the range of values, since a product accurate in the middle of its range can be poor at its extremes.
Two difficulties are specific to them. The spatial support differs, a ground measurement covering a plot and a pixel covering a larger area, which makes comparison approximate by construction. And the reference itself is a measurement with its own uncertainty, which must be propagated rather than ignored.
That second difficulty connects to the climate article, which showed uncertainty characterisation per pixel to be the field’s standard for exactly this reason.
What a buyer of Earth observation products should require
Six items make a validation claim verifiable, and their absence is itself informative.
The sampling design, described rather than asserted, with the sample size and any stratification.
The error matrix, in raw counts rather than normalised, since normalisation destroys the difference between user’s and producer’s accuracy.
The three accuracy measures, per class rather than aggregated.
The area estimates adjusted for classification bias, with confidence intervals.
The geographic and temporal scope over which the assessment holds, since the AI article showed transferability is the field’s principal limit.
And the reference’s own quality, estimated rather than assumed.
A supplier able to provide those six has conducted a serious assessment. One providing only an overall accuracy figure has provided a number whose meaning cannot be established.
Who conducts the validation
One organisational question deserves stating, since it determines whether an assessment is credible.
A validation conducted by whoever built the product carries a structural conflict. The same team chose the classes, built the training data and now judges the result, which is the configuration earlier clusters described as producing systematic errors nothing internal detects.
Three arrangements address it, in increasing order of credibility.
Separation within a team, the reference being built by people who did not build the training set and to conventions fixed independently.
An external reference, built by a third party under an agreed sampling design, which removes the conflict on the reference while leaving the analysis internal.
And a fully external assessment, where a third party builds the reference and computes the figures, which is what regulated domains require and what institutional buyers increasingly expect.
The second arrangement is the practical optimum for most projects. It costs a fraction of the third, it removes the conflict where it matters most, and it produces a reference the buyer can audit independently of the model that was judged against it.
The limits of the exercise
An honest reading requires setting out what validation does not establish.
It measures performance on the reference used, not performance in general, a distinction the medical imaging cluster quantified in another domain.
It holds over the geography and period sampled, and it says nothing about others.
It cannot exceed the quality of its reference, as set out above.
And it measures agreement rather than truth, the reference being itself an interpretation where no direct measurement exists.
Those four limits do not devalue the exercise. They indicate what a validated product can be claimed to do, which is more than an unvalidated one can be claimed to do and less than a bare accuracy figure suggests.
Validating an Earth observation product over time
One dimension deserves separating because a validation ages.
A product validated on data from a given period may perform differently later, for three documented reasons.
The sensor changes. Calibration drifts, satellites are replaced by newer generations, and the constellations article showed a constellation contains satellites of different generations.
The ground changes. Agricultural practices, urban form and land use evolve, which alters the appearance of the classes the model learned.
And the processing chain changes. A library update or an algorithm revision modifies inputs, which the errors articles in earlier clusters documented.
The consequence is that validation is periodic rather than one-off, which turns the reference corpus into a maintained asset. That is the same conclusion the article on standard developments reached regarding drift monitoring, and it holds here under commercial rather than regulatory pressure.
A proportionate validation arrangement
Not every project warrants the full apparatus, and matching effort to stakes is itself good practice.
An exploratory project can settle for a modest sample and per-class accuracy figures, provided it does not claim more than that supports.
An operational product requires the full arrangement described above, since decisions rest on it.
A product feeding a contractual mechanism, which the insurance article described, requires in addition that the method be auditable by a third party.
And a product entering an institutional context requires the documentation the security article set out, on top of the statistical assessment.
That gradation avoids two symmetrical errors: over-engineering an exploration, and under-validating a product that decisions depend on.
Why this requirement is ignored in Earth observation
One observation explains the gap between the literature and common practice.
Three reasons account for it. The methods are statistical rather than technical, and the teams building these products are trained in machine learning rather than in survey sampling. The effort is substantial and it produces no visible feature, which makes it easy to defer. And nobody requires it in most commercial contexts, unlike the regulated domains earlier clusters described.
That third reason is changing. The sovereignty and security articles showed institutional demand growing, and institutional buyers do ask these questions.
The practical implication is that a provider adopting these practices now is preparing for a requirement that is arriving rather than responding to one that exists, which is a considerably cheaper position than the reverse.
What this requirement opens for a provider
Three commercial consequences follow.
The first is that building a reference sample under a documented probabilistic design is a methodological competence distinct from annotation itself, and it is markedly less widespread.
The second is that this competence demonstrates in writing. A documented sampling design, with its stratification and inclusion probabilities, is a verifiable deliverable that immediately distinguishes an offering.
And the third is that these requirements come from the field’s own scientific literature, which makes them citable rather than debatable. A provider referring to them rests on an established standard rather than a self-proclaimed one, an advantage the climate article already noted.
Reading someone else’s accuracy figure
Most Earth observation projects consume validated products rather than validating their own, and reading a published figure correctly is its own skill.
Four questions extract most of the meaning from any Earth observation accuracy claim.
Over what area and period was it measured. A figure from one region says little about another, and the AI article documented why transferability is the field’s principal limit.
Is it overall accuracy or per-class. If only overall is published, the rare classes are almost certainly performing worse than the headline suggests, and rare classes are frequently the ones a project cares about.
How was the reference obtained. Field survey, photo-interpretation and an existing map carry different reliability, and the opening article showed an inherited map caps accuracy at its own.
And what sample size and design produced it. A figure from a few dozen convenience points and one from a stratified sample of thousands are not comparable, whatever the numbers look like.
Those four questions are answerable from a properly documented assessment and unanswerable from a marketing figure, which is itself the fastest way to tell the two apart.
Common errors of reading
These misreadings recur often enough that naming them is usually enough to avoid them.
- Estimating area by counting pixels on the map.
- Relying on overall accuracy without examining per-class accuracy.
- Confusing user’s accuracy with producer’s accuracy.
- Normalising an error matrix before interpreting it.
- Building a reference sample on convenient areas.
- Using estimation formulas that do not correspond to the sampling design.
- Omitting confidence intervals on an area estimate.
- Evaluating a model on the same image chips used for its training.
- Neglecting to estimate the quality of the reference itself.
- Treating validation as a one-off rather than a periodic exercise.
- Applying an error matrix to a continuous product.
- Claiming a scope wider than the geography and period sampled.
Why validation is where corpora prove their worth
A closing observation connects this article to the argument running through this Earth observation cluster.
Everything described here depends on one thing: a reference sample built to a documented design. The error matrix comes from it. The adjusted areas come from it. The confidence intervals come from it. The per-class figures come from it.
That reference is annotated data, built by people, under a sampling plan, with documented conventions. It is exactly the artefact this series has described as the field’s scarce input, appearing here in its most consequential role.
Two consequences hold. A project that treats annotation as a training cost misses that the same competence produces the thing that makes any claim about the model defensible. And a provider that can build a reference sample to a probabilistic design supplies something structurally different from one that can only label images, even where the labelling itself is identical.
The distinction is not in the annotation. It is in the sampling design surrounding it, which costs a day of thought and determines whether the resulting figures mean anything at all.
What to take away
A map can show high overall accuracy and supply a wrong area estimate, classification error biasing pixel counting in a way only a reference sample can correct.
Three readings emerge. Good practice explicitly cautions against pixel counting for area estimation and recommends estimating from the reference classification, with areas adjusted for classification bias and accompanied by confidence intervals. Probability sampling with known inclusion probabilities is treated as non-negotiable, the authors indicating it is difficult to envisage a circumstance where a departure would be acceptable for a rigorous assessment. And the quality of the reference bounds measurable accuracy, which makes estimating annotator disagreement not a refinement but the measurement that tells you what any accuracy figure can mean.
For the economics of data access, the article on the cost of Earth observation data examines the models. For the fundamental difficulty this validation meets, the article on AI and Earth observation covers the annotated data bottleneck.
To explore delivery arrangements, supported formats and applicable control mechanisms, see our dedicated page on geospatial data processing. And if you need a reference sample built under a documented probabilistic design, let us discuss your project.