Image annotation has long been the backbone of computer vision projects. For years, data teams worked almost exclusively with 2D data: photographs, satellite images, radiographs, camera feeds. Tools, methodologies, and quality standards were built around this reality. Then came LiDAR.
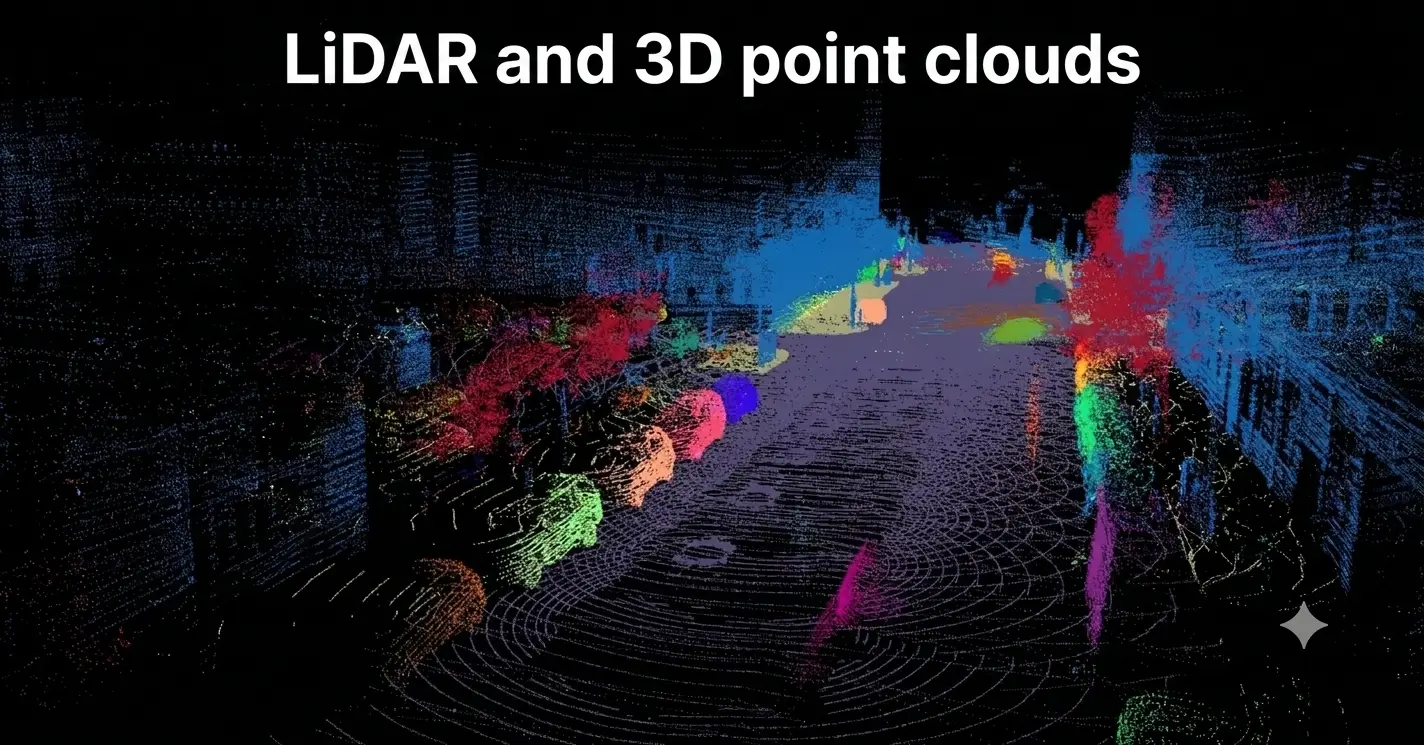
LiDAR (Light Detection And Ranging) does not produce images in the conventional sense. It generates point clouds: three-dimensional representations of physical space, where each point carries X, Y, and Z coordinates along with additional attributes such as return intensity or echo number. This data is structurally different from an RGB image. Annotating a point cloud requires rethinking the entire image annotation process: the geometries used, the tooling required, the quality metrics that matter, and the guidelines given to annotation teams.
This article covers the transition from 2D to 3D: why it has become necessary in several industries, what it changes concretely for image annotation workflows, and how to structure a LiDAR annotation project to produce reliable, model-ready training data.
Where 2D Image Annotation Reaches Its Limits
A 2D image is a flat projection of a three-dimensional scene. That projection carries rich visual information, texture, color, contrast, but it collapses one critical dimension: depth. For many applications, this loss is entirely acceptable. Detecting a skin lesion in a dermatology image, classifying weeds in aerial agricultural footage, reading barcodes on a production line: these tasks work reliably in 2D.
For other applications, however, spatial information is not optional, it is the entire point.
An autonomous vehicle navigating traffic cannot rely on photographs alone: it needs to know how far away a crossing pedestrian is, how high a curb stands, whether the object ahead is another vehicle or a concrete barrier. An industrial robot picking components from a conveyor needs the precise three-dimensional position of each item to calibrate its gripper accurately. A city mapping system cannot reconstruct the geometry of an intersection from a set of photos captured at varying angles.
In all these contexts, conventional image annotation, 2D bounding boxes, flat segmentation masks, is insufficient. Models trained exclusively on 2D data lack the spatial awareness these applications demand. This is why LiDAR sensors have become standard in perception-critical industries, and why a new image annotation paradigm has emerged alongside them: one that incorporates the Z dimension into every labeling decision.
The global 3D LiDAR data annotation market was valued at USD 1.87 billion in 2025, with a projected 20% compound annual growth rate through 2030. Autonomous driving alone accounts for approximately 65% of total demand. A typical Level 4 autonomous driving program requires around 50,000 hours of LiDAR annotation for initial model training and ongoing refinement. These figures reflect a straightforward business reality: industries that need models to understand space in three dimensions are investing heavily in high-quality annotated data.
Understanding LiDAR Point Cloud Data Before Annotating
Before addressing annotation methods, it is essential to understand what LiDAR data actually is. A LiDAR sensor emits laser pulses at extremely high frequency and measures the time each pulse takes to return after bouncing off a surface. The output is a set of millions of georeferenced points in three-dimensional space, each carrying at minimum an X, Y, Z coordinate and often additional attributes: return intensity, echo number, or color information when the LiDAR is fused with an RGB camera.
These data come in several formats that vary by industry and application: LAS and LAZ for geospatial and topographic work, PCD and PLY for robotics and academic research, BIN and PCAP for autonomous driving, and ROSbag for embedded systems. Each format requires specific reading and visualization tools, making pipeline standardization more complex for 3D image annotation than for 2D workflows, where PNG, JPEG, and TIFF cover the vast majority of use cases.
Point density varies substantially depending on the sensor type and capture distance. An object five meters from the sensor may be represented by thousands of points; the same object at eighty meters may produce only a few dozen. This density heterogeneity is one of the primary challenges for image annotation teams working on LiDAR data: guidelines must explicitly address how annotators should handle sparse regions and near-empty zones.
Unlike an RGB image where every pixel occupies a fixed position in a regular grid, a point cloud is an unordered set of coordinates in space. Annotators are not looking at a “picture”, they are navigating a three-dimensional representation they must rotate, pan, and zoom across multiple viewing axes to understand the scene and position their labels accurately. This spatial navigation requires specific training and tooling that differ fundamentally from conventional 2D image annotation workflows.
For a broader grounding in image annotation principles and the full lifecycle of a computer vision training project, the
complete guide to training a computer vision model covers the end-to-end process from data collection to model evaluation.
Image Annotation Geometries for LiDAR Point Clouds
Image annotation on LiDAR data relies on geometries that have no direct equivalent in 2D. Depending on the use case and required precision, teams typically work with several complementary approaches that can be combined within a single dataset.
3D Cuboids (Bounding Boxes in Volume)
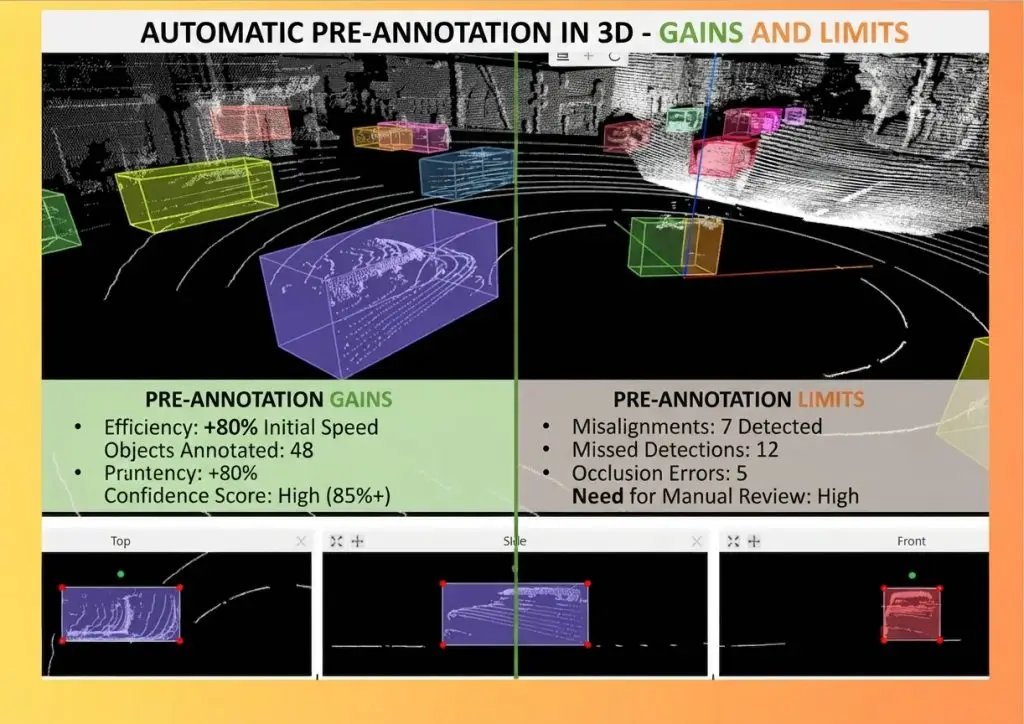
Cuboids are to point clouds what rectangular bounding boxes are to 2D images: the foundational geometry, the fastest to place, and the most widely supported by training frameworks. A cuboid defines an object by its center coordinates (X, Y, Z), its dimensions (length, width, height), and its angular orientation in space.
That orientation is a fundamental departure from 2D annotation. A 2D bounding box is always aligned with the horizontal and vertical axes of the image plane. A 3D cuboid can face any direction: a vehicle parked at an angle, a pedestrian mid-turn, a tilted pallet on a sorting conveyor. Annotators must not only position and size the cuboid correctly but also align its orientation, typically by adjusting yaw angle and in some cases pitch and roll, depending on the application.
Cuboids are best suited for discrete, relatively compact objects: vehicles, pedestrians, cyclists, urban furniture, logistics packages. They are less appropriate for continuous surfaces (roads, buildings, vegetation) or objects with irregular shapes that do not conform to a rectangular volume.
In autonomous driving projects, each cuboid is assigned a unique identifier that persists across frames, enabling multi-object tracking. A size consistency constraint, the same vehicle must maintain approximately the same dimensions from frame to frame, is one of the strictest quality rules in LiDAR image annotation, as abnormal size variation across a sequence reveals annotation inconsistencies that can meaningfully degrade detector performance.
Semantic Point-Level Segmentation
Semantic segmentation in point clouds means assigning a class label to every individual point in the cloud. Each point receives a tag: “road”, “sidewalk”, “building”, “tree”, “vehicle”, “pedestrian”, “barrier”, and so on. The result is an exhaustively classified point cloud that provides a complete, continuous understanding of the scene in three dimensions.
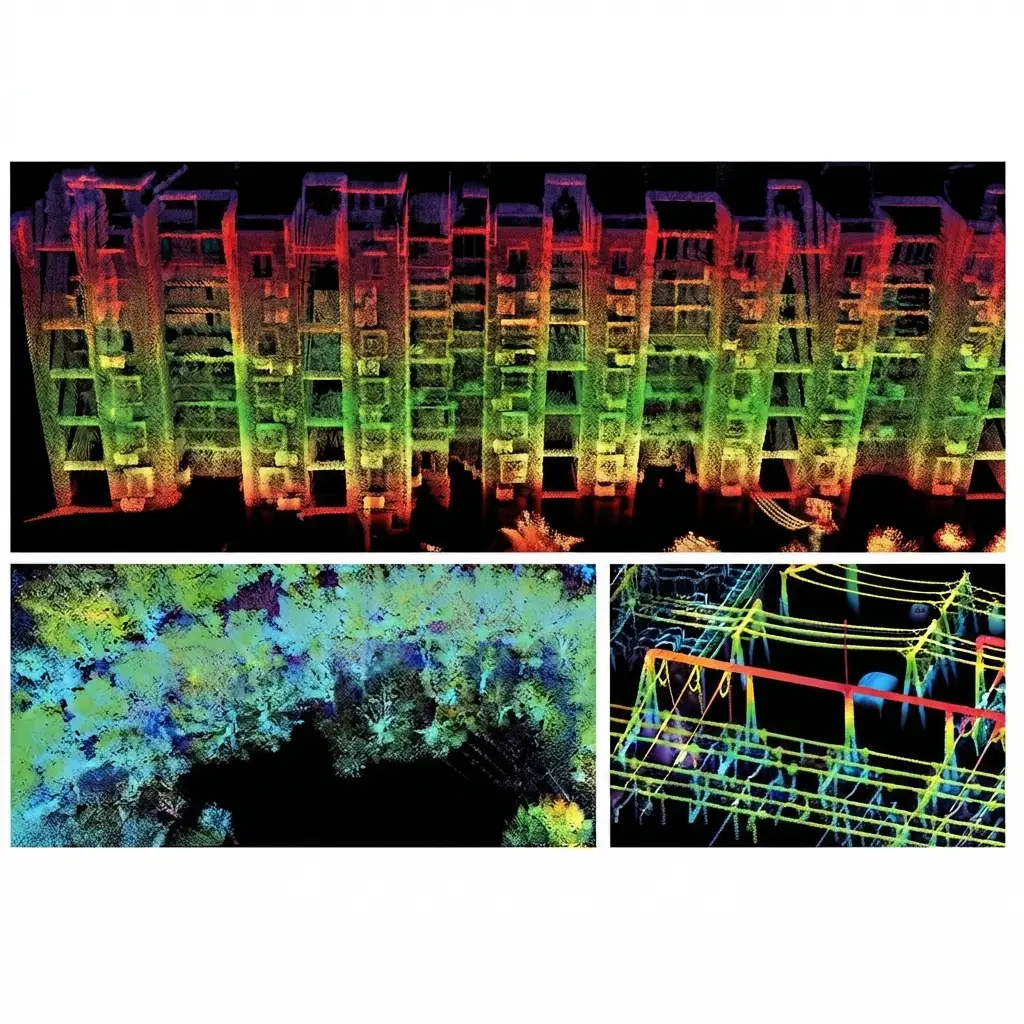
This approach is the most precise but also the most demanding from an image annotation standpoint. It requires tools capable of rendering the point cloud across multiple synchronized views, top-down, front cross-section, lateral cross-section, and free 3D perspective, to ensure no point is left unclassified or misclassified. Semantic point-level segmentation is essential for applications that need a fine, exhaustive environmental understanding: precision urban mapping, linear infrastructure inspection, forest inventory, smart city deployments.
The semantic richness of this type of 3D image annotation depends directly on the ontology defined before production starts. A seven-class ontology for a forest inventory (trunks, foliage, shrubs, ground, buildings, pedestrians, vehicles) is fundamentally different from a seventeen-class ontology designed to cover complex urban mobility scenarios including multiple vulnerable road user types. Richer ontologies require proportionally more precise guidelines to prevent boundary ambiguities between adjacent classes.
Instance Segmentation
Instance segmentation takes semantic segmentation one level further: it assigns not only a class label to each point but also a unique identifier to each distinct object within a class. Where semantic segmentation says “these points belong to the vehicle class,” instance segmentation specifies “these points belong to vehicle 14, and those to vehicle 15.”
This distinction is critical for object counting, multi-entity tracking, and individual behavioral analysis. It is also considerably more demanding in terms of image annotation effort: annotators must individually identify and separate each object even in dense scenes where vehicles are close together, touching, or partially overlapping from the sensor’s perspective. The cognitive load per frame is significantly higher than for semantic labeling alone.
3D Polygons and Polylines
For linear features (roads, rails, utility lines) or surface features (building footprints, parking areas, cycle lanes), 3D polygons and polylines offer an alternative to volumetric approaches. These geometries are particularly useful in cartographic and ortho-LiDAR image annotation work, where the goal is to delineate surfaces and linear structures on the ground rather than identify discrete objects in space.
A road annotation project might combine 3D cuboids for vertical elements (street lights, traffic signs, signals) and polygons for horizontal surfaces (carriageway, sidewalk, cycle path, parking). This hybrid approach optimizes both representation accuracy and team productivity, and it is a common pattern in large-scale urban mapping programs.
The Distinct Challenges of 3D Image Annotation
Moving from 2D image annotation to 3D point cloud annotation is not simply an incremental increase in complexity. It represents a paradigm shift that affects tool ergonomics, annotator training, guideline design, and quality assurance protocols. Understanding these challenges in advance is the prerequisite for managing them effectively.
Density Variability and Sparsity
The same object may be represented by hundreds of points close to the sensor, or by only a handful at distance. This increasing sparsity with range is one of the defining difficulties of LiDAR image annotation: a pedestrian at five meters is easy to identify and tightly bound, while the same pedestrian at sixty meters may amount to ten or fifteen points that are hard to distinguish from background noise.
Guidelines must explicitly address these edge cases: at how many points should an object be annotated? How should objects at the sensor’s range limit be handled? What is the protocol for objects partially outside the sensor’s field of view? These decisions must be documented, consistently applied across the entire dataset, and revisited whenever the dataset is extended to new capture conditions.
Occlusions in Three Dimensions
In 2D, occlusions are visually apparent: one object covers part of another in the image plane. In 3D, occlusions are more complex because they depend on the specific viewpoint of the LiDAR sensor. A pedestrian partially hidden behind a vehicle may have only a few dozen visible points on the sensor-facing side. Annotators must decide how far to extend the cuboid to cover the hidden portion, based on a reasoned inference about the object’s probable geometry.
This “reasoned estimation” of hidden geometry is a specific skill that annotation teams must acquire through training and calibrated practice. Guidelines need to define clear rules: the degree of occlusion beyond which an object is flagged as “partially visible,” how to handle objects that are fully behind another in the sensor’s perspective, how to manage cases where two objects overlap in 3D space.
Multi-Sensor Fusion
In the most demanding applications, LiDAR does not operate in isolation. It is coupled with RGB cameras, millimeter-wave radar, and sometimes additional LiDAR sensors placed at different angles to eliminate blind spots. Image annotation in this context becomes multimodal annotation: the same objects must be labeled consistently across both the LiDAR point cloud and the corresponding camera images, with precise temporal synchronization between data streams.
3D-to-2D projection (and its inverse) provides a cross-validation check between modalities. A misplaced or misoriented 3D cuboid reveals itself immediately when projected onto the corresponding camera image: the box fails to correctly envelope the visible object. This cross-modal verification workflow has become standard practice in autonomous driving programs, even though it adds a significant layer of effort to the overall image annotation process.
Tool Ergonomics and Team Training
2D image annotation takes place in an intuitive interface close to a vector drawing tool: point, click, draw. 3D point cloud annotation requires navigating a spatial environment: rotating the scene, shifting viewpoints, zooming into sparse regions across multiple display axes simultaneously. This interface complexity extends the onboarding time for new annotators and increases the risk of geometric errors caused by poor viewing angles or inaccurate depth perception in a 3D interface.
The best-adapted tools offer synchronized multi-view displays (top-down plan, frontal cross-section, lateral cross-section, free 3D view) and navigation aids that reduce cognitive overhead. Automatic pre-annotation, where available and validated against the project’s data type, can reduce manual annotation time by a factor of approximately four while maintaining human review and correction for quality assurance.
LiDAR Image Annotation Tools: 2026 Landscape
The market for 3D image annotation tooling has matured substantially over the past few years, with specialized platforms emerging alongside generalist tools originally designed for 2D workflows. Tool selection is a structuring decision for any LiDAR image annotation project, as it directly determines team productivity, available geometry types, and the depth of quality control that can be embedded in the workflow.
CVAT
CVAT (Computer Vision Annotation Tool), originally developed by Intel and widely adopted across the open-source ecosystem, is one of the most used solutions for 2D image annotation. Its 3D module is functional but limited: it supports 3D cuboids with multi-view synchronization but does not offer native semantic point-level segmentation. It is a reasonable choice for moderate-volume projects with relatively standard cuboid requirements, but insufficient for use cases demanding full point classification or complex multi-sensor fusion workflows.
Supervisely
Supervisely is a platform built primarily for 2D image annotation that has progressively integrated 3D capabilities. Its main differentiator is model-assisted pre-annotation, which can accelerate workflows on well-defined data types significantly. It suits teams that handle both 2D and 3D annotation on the same projects and want unified tooling across modalities.
Specialized LiDAR Platforms
Platforms such as Segments.ai, Kognic, and Deepen AI were designed specifically for 3D annotation, particularly for autonomous perception use cases. They offer advanced capabilities: multi-frame tracking with temporal consistency constraints, integrated LiDAR-camera fusion workflows, configurable quality assurance pipelines, and per-frame audit tracking. These tools are better suited to high-volume projects or technically complex scenarios involving multiple sensors, diverse object classes, and strict quality requirements.
Selection Criteria
Selecting the right tool for a LiDAR image annotation project requires evaluating several dimensions simultaneously: compatibility with the project’s specific data formats (LAS, PCD, BIN, ROSbag), support for the required geometry types (cuboids, semantic segmentation, polygons, object attributes), automatic pre-annotation capabilities and their precision on the target data type, integrated quality control and reporting features, and on-premise hosting options for sensitive or geographically restricted data.
For projects that also involve sequential data annotation, the tracking and temporal consistency challenges described in
video annotation: tracking, interpolation and temporal consistency apply with even greater force in 3D, where object orientation adds an additional constraint on top of identity persistence across consecutive frames.
Quality Control in 3D Image Annotation: Metrics and Methods
Quality control for 3D image annotation cannot rely solely on the metrics inherited from 2D workflows. The standard Intersection over Union (IoU), computed on rectangles in a plane, gives way to 3D IoU, which accounts for the volume and orientation of annotated cuboids. The precision requirements are of a different nature: an orientation error that would be invisible in a 2D bounding box can produce a misaligned cuboid that meaningfully degrades detector performance in production.
3D IoU and 3D mAP
3D IoU measures the ratio of the intersection volume to the union volume of two cuboids: the annotated cuboid and the ground truth reference. It is sensitive not only to position and dimensions but also to angular orientation. A correctly positioned and sized cuboid that is rotated fifteen degrees off-axis can produce a 3D IoU well below the acceptance threshold, even if the object appears visually enclosed from a casual viewing angle.
3D mAP (mean Average Precision in three dimensions) extends this metric to the full dataset scale, computed per object class and averaged across the project. It enables objective comparison of image annotation quality across different teams, annotation campaigns, or tooling configurations, a valuable asset when scaling production across multiple batches or vendor teams.
Temporal Consistency as a Quality Criterion
For multi-frame tracking projects, temporal consistency adds a dimension to standard quality control. An object labeled as “vehicle 7” must maintain approximately the same dimensions throughout the annotation sequence. Abnormal size variation between consecutive frames is a quality alert that should trigger a targeted review of the corresponding image annotation frames and, where needed, a guideline update to address the underlying edge case.
This consistency constraint is one of the most difficult to verify automatically at scale, since it requires analyzing per-identifier dimensional variance across entire sequences rather than evaluating each frame in isolation. Specialized platforms typically offer consistency dashboards that flag anomalies automatically, reducing the manual review burden for quality teams.
A Multi-Level Quality Protocol
An effective quality protocol for LiDAR image annotation operates across several complementary levels. A first tier of review is conducted by experienced annotator-reviewers covering 100% of produced frames. A second independent tier, conducted by a quality control department separate from production, applies statistical sampling: 25% for a standard 95% quality target, 50% for a reinforced 97% target. For projects with very high stakes, active safety systems, critical infrastructure, independent QC sampling can be extended to 100%, ensuring exhaustive review of every annotated frame.
This multi-level protocol is especially important in 3D because errors are structurally less visible than in 2D. A slightly under-sized or off-axis cuboid may have significant downstream impact on model performance at long detection ranges, precisely where point density is lowest and where every correctly annotated object contributes the most to training signal quality.
Integrating LiDAR Image Annotation into an AI Strategy
A LiDAR image annotation project requires upfront investment in several areas: rigorous ontology definition (which classes, which attributes, at what range), guidelines tailored to 3D-specific scenarios (sparsity, occlusion, tracking constraints), tool selection compatible with the project’s data formats and geometry requirements, and a quality protocol calibrated for 3D metrics. None of these elements can be improvised after data collection starts.
In-House vs. Outsourcing
The build-or-buy question deserves a specific analysis for LiDAR image annotation. 3D point cloud annotation is significantly slower and more technically demanding than standard 2D image annotation. Throughput rates per annotator hour are lower, and the learning curve for 3D tools and domain-specific guidelines is longer.
An internal team without prior experience in LiDAR image annotation is likely to produce data with systematic quality issues that are difficult to detect without a structured QA protocol: cuboids under-dimensioned in depth (the axis hardest to evaluate in 3D), tracking inconsistencies across frames, unclassified points in sparse regions. These errors carry a real cost: degraded model performance in production and unplanned retraining cycles that erode the business case of the AI project.
Outsourcing to teams specialized in LiDAR image annotation provides access to expertise built across multiple projects in different sectors, autonomous driving, robotics, geospatial, smart city, industrial inspection, along with adapted tooling and proven quality processes. It also provides the flexibility to absorb volume peaks without permanent investment in 3D visualization hardware, software licenses, and ongoing training programs.
Data Security for LiDAR Projects
Data security is a non-negotiable dimension in LiDAR image annotation projects. Autonomous driving datasets contain precise geolocation information about captured environments, road users, and infrastructure. Industrial inspection or defense projects impose specific data localization and certification requirements. High-resolution forestry or geospatial data may be subject to export restrictions under applicable national regulations.
These constraints must inform tool selection and provider qualification from the outset: controlled hosting environments, ISO 27001 compliance, access traceability, non-disclosure agreements. They belong to the provider selection criteria alongside technical quality performance, not as an afterthought once production is already underway.
Sizing a LiDAR Annotation Project
Sizing a LiDAR image annotation project accurately depends on several variables: total number of frames to annotate, average object density per frame, ontology complexity (class count and attribute count), geometry types required (cuboids alone, with semantic segmentation, or combined with polygons), and target quality level. Per-frame effort for LiDAR image annotation is typically three to five times higher than for a comparable 2D image, depending on scene density and geometry requirements.
Anticipating this accurately enables realistic planning of resources and timelines, and avoids the under-scoped commitments that typically lead to quality trade-offs at end of project. A test batch annotated and quality-evaluated before full-scale production launches is a systematically worthwhile investment: it validates guidelines, calibrates throughput estimates, and identifies edge cases before they scale.
If you are structuring a project that incorporates LiDAR image annotation, whether in 2D, 3D, or a multi-sensor fusion architecture, the
Infoscribe AI team specializing in 2D and 3D computer vision annotation can support you from ontology design through quality-controlled data delivery.
Contact us to discuss your project and receive an estimate.