
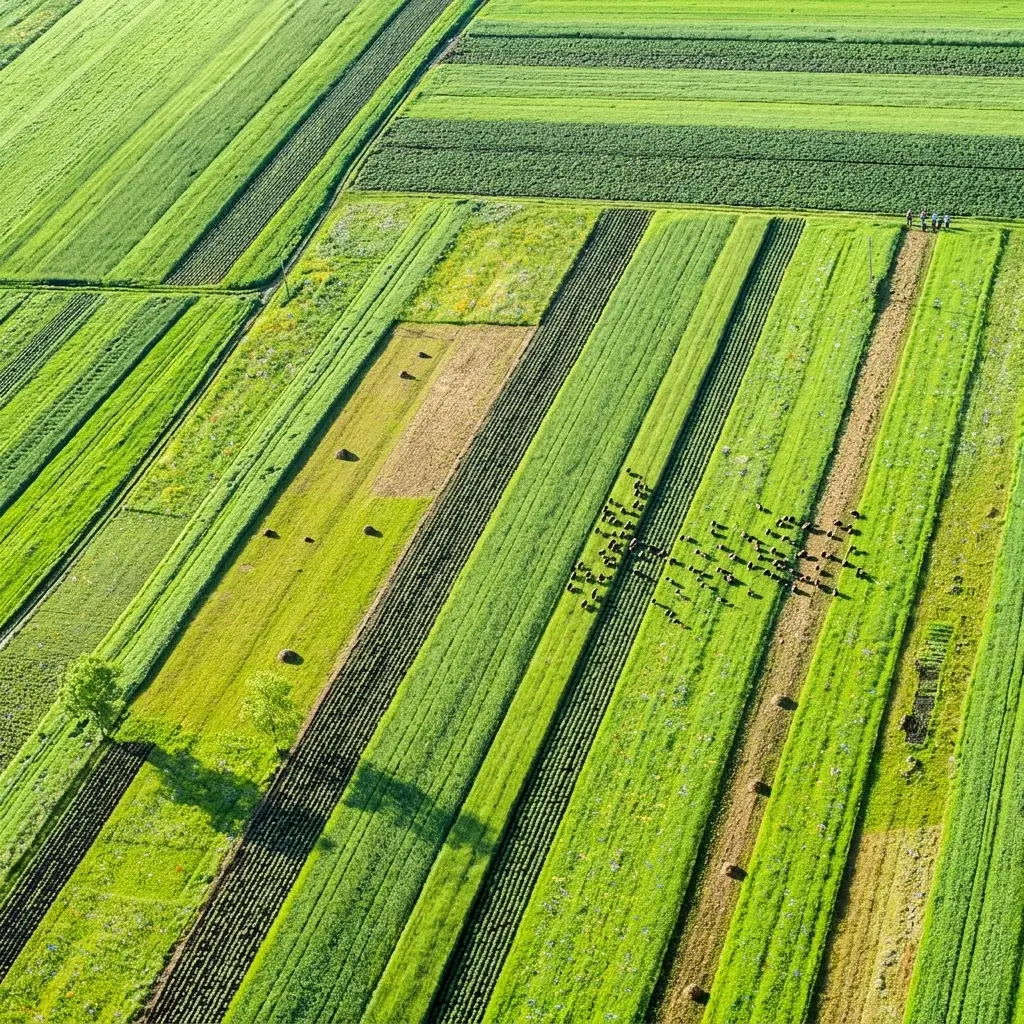
A farm parcel does not exist on the image, only in the registers. Its boundaries come from a tenancy agreement or a cropping decision, and one same surface splits or merges from one year to the next without any marker moving.
This article sets out those difficulties. It extends the article on deforestation.
The uses that structure the field
Six agricultural applications occur in satellite imagery.
Checking the area declarations filed by farmers.
Identifying the crop actually present on each parcel.
Monitoring crop condition throughout the season.
Estimating the yields expected ahead of harvest.
Detecting bare soils along with the various cover crops.
And verifying the agri-environmental practices that have been declared.
One important practical consequence follows. The first use requires an outline accuracy far above the others, a declared area serving as the basis for a payment, which shifts the demand from recognition towards geometry.
What the parcel boundary covers
Five situations make the division ambiguous in satellite imagery.
Two different crops present within one same declared parcel.
One single crop spread across several adjoining parcels.
A grass margin belonging or not to the surface genuinely farmed.
A farm track crossing an otherwise homogeneous block.
And a perfectly invisible boundary between two neighbouring farmers.
One important observation follows for a satellite imagery project. The last situation is resolved by no observation, two parcels cropped identically by different farmers being indistinguishable, which makes the register indispensable rather than merely useful.
What identifying a crop presupposes
Five elements direct recognition in satellite imagery.
The date on which the vegetation cover appears in spring.
The growth rhythm observed across the weeks.
The harvest date, by far the most discriminating of the five.
The texture of the cover, which is proper to each species.
And colour, by far the least reliable of the five.
One practical consequence follows. The third element explains why a single image almost never suffices on this subject, two cereals resembling each other entirely in full growth and separating clearly only by their harvest calendar.
What indices bring
Four satellite imagery uses follow from an index computed on the spectral bands.
Estimating the cover’s vigour with no visual annotation at all.
Monitoring one same parcel’s evolution across a whole season.
Comparing several parcels with each other at an identical date.
And spotting an anomaly while knowing nothing of what causes it.
One observation follows. The last use marks the limit of these indices, a low value flagging a problem without designating its nature, which leaves entirely open the question the annotation must settle.
What the time series imposes
Four satellite imagery constraints accompany monitoring across a whole season.
The number of acquisitions available determines what stays identifiable.
Gaps caused by cloud come to break the continuity of the signal.
The cropping calendar varies by region as much as by year.
And comparison between two years presupposes properly aligned dates.
One important practical consequence follows for a satellite imagery project. The second constraint is better managed at acquisition than in processing, a series interrupted at harvest time losing precisely the most discriminating information for identifying the crop.
What the reference requires here
Four sources establish an agricultural ground truth in satellite imagery.
The area declarations filed each year by the farmers.
Field surveys conducted on a sample of parcels.
Records of cropping practice kept by the farms themselves.
And interpretation conducted by an agricultural technician.
One important observation follows. The first source is complete and declarative, which makes it excellent for training and questionable for evaluating a check, precisely because the gap between declaration and reality constitutes the object of the check.
What crop imbalance imposes
Four satellite imagery effects accompany a very uneven distribution of species.
Three or four crops cover on their own most of a given territory.
The minority species appear very little in a random sample.
An overall accuracy lets itself be carried entirely by the dominant crops.
And enrichment of the corpus must explicitly target the rare species.
One important observation follows for a satellite imagery project. The third effect misleads systematically, a system correctly identifying wheat and maize showing a high score while failing on specialty crops, which are often the ones whose checking matters most.
What the measurement must reflect
Five indicators describe such a satellite imagery system’s performance.
The accuracy of the crop identified, systematically broken down by species.
The correctness of the computed areas, systematically set against the declarations.
The performance obtained on the territory’s minority crops.
The date from which identification becomes genuinely reliable.
And the behaviour observed during an atypical climatic year.
One important practical consequence follows. The fourth indicator interests the use more than the final performance does, an accurate identification in October being worth less than an approximate one in June for anyone who must decide before harvest.
What the regional calendar imposes
Five factors shift the dates from one region to another in satellite imagery.
Latitude, which appreciably advances or delays the start of the growth.
Altitude, which produces marked gaps over short distances.
The variety sown, early or else late according to the farmer’s choice.
The year’s weather, which shifts the whole growing cycle.
And the local practice adopted, autumn or else spring sowing.
One important practical consequence follows. Those five factors forbid transposing a model from one territory to another, a system trained on a single region producing false identifications elsewhere for want of recognising the shift in dates, which makes geographic coverage far more decisive here than on most other subjects handled.
What the annotation must produce
Five annotation forms occur in satellite imagery according to the intended use.
A parcel outline, most often taken from an existing register.
A crop class assigned to each of the parcels.
A mask of bare soil or of vegetation cover according to the date.
A delimitation of the heterogeneous zones within parcels.
And an anomaly flag with no qualification at all of its cause.
One important observation follows for a satellite imagery project. The fourth form interests the farmer far more than the others, heterogeneity observed within a parcel designating a localised problem to be addressed, whereas the other four serve mostly administrative or statistical needs.
What crop rotation changes
Four satellite imagery effects accompany a cropping plan that varies each year.
One same parcel carries an entirely different crop from one season to the next.
A corpus ages without any error at all having been committed.
The most probable sequences help rule out certain hypotheses.
And an old annotation never gets reused as it stands.
One important practical consequence follows for a satellite imagery project. The second effect clearly separates this field, a building corpus staying valid for years whereas a crop corpus describes a single campaign, which requires an annual rebuild the initial budget rarely provides for.
What parcel size changes
Four satellite imagery effects accompany a fragmented parcel pattern.
A parcel of small size holds very few usable pixels.
Margins then represent a substantial share of the surface.
Spectral mixing with the neighbouring parcels increases markedly.
And the number of objects to handle rises very sharply at equal surface.
One important observation follows for a satellite imagery project. The third effect limits what ordinary resolution permits, a narrow parcel returning a signal contaminated by its neighbours, which makes some older parcel patterns far harder than the large plains of consolidated holdings.
What this work’s throughput presupposes
Four factors determine the time spent per parcel in satellite imagery.
Whether or not an outline is already available from a register.
The number of dates to consult before identifying the crop.
The diversity of crops genuinely present across the territory.
And whether or not delimitation within parcels is required.
One important practical consequence follows. The first factor produces the widest gap, an already supplied outline reducing the work to the sole assignment of a class whereas an outline to be traced multiplies the time several times over, which makes access to the parcel register decisive for cost as much as for correctness.
What the annotator must know here
Five kinds of knowledge condition correct work on this subject.
The cropping calendar proper to the region actually handled.
The appearance of bare soil, that of a cover crop and that of an established crop.
The most common confusions between species at the same stage.
Reading a full series of images rather than one isolated view.
And the treatment rule applied to heterogeneous parcels.
One important observation follows for a satellite imagery project. The fourth kind changes the nature of the work, an annotator having to compare several dates before settling rather than deciding on what they see, which presupposes a suitable interface and training that single-image projects do not require.
What the delivery format requires here
Four choices condition the client’s reuse of the satellite imagery result.
The linkage to the parcel identifier taken from the register employed.
The precise campaign to which each crop assignment relates.
The acquisition dates that actually served to establish the identification.
And a confidence indication bearing on the doubtful parcels.
One important practical consequence follows for a satellite imagery project. The second choice avoids a costly confusion, an undated crop layer becoming unusable from the following campaign onwards, whereas the same layer accompanied by its year keeps its value within a multi-year series.
What pre-annotation permits here
Three uses appreciably lighten satellite imagery work on this subject.
A crop proposal founded on the parcel’s complete temporal profile.
A sorting of parcels by the degree of certainty of that proposal.
And a flagging of parcels whose profile departs markedly from the ordinary.
Two caveats accompany it in satellite imagery.
A proposal founded on an ordinary year regularly fails on an atypical one.
And sorting by certainty discards precisely the parcels that most deserved examination.
What the first batch must establish
Four results justify a trial batch before the campaign.
The date from which crops become genuinely separable across this territory.
The list of the most recurrent confusions between local species.
The number of acquisitions staying usable despite the cloud cover.
And the gap observed between the computed areas and those of the register.
One important practical consequence follows for a satellite imagery project. The first result determines the project’s whole calendar, separation becoming possible in June or only in September depending on the crops present, which decides whether the result will be able to serve before harvest or only afterwards.
What the image source changes here
Four supports occur for this kind of satellite imagery project.
Public programmes, free and frequent enough for this subject.
Commercial imagery, finer but billed by the surface covered.
Aerial orthophotography, very fine but only rarely repeated.
And radar, which passes through cloud at the most decisive moments.
One important practical consequence follows for a satellite imagery project. The first support suits this subject particularly well, a farm parcel being large enough for free resolutions, which shifts the outlay from acquisition towards annotation, exactly the reverse of the situation in the chapter on solar panels.
What this field shares with ground agronomy
Four findings recur at parcel scale as much as at territory scale.
The development stage entirely governs what stays identifiable.
An acquisition window missed is recovered only in the following campaign.
The errors that genuinely count bear on the class rather than on the outline.
And coverage of conditions is always worth more than image volume.
One important observation follows for a satellite imagery project. Those four findings belong to living matter rather than to the scale of observation, a satellite project and a ground project running into the same calendar constraints despite entirely different arrangements.
What the corpus must cover here
Five axes structure an agricultural dataset built in satellite imagery.
The regions handled, whose cropping calendars differ markedly.
The successive campaigns, whose conditions vary strongly.
The minority crops, systematically absent from a random sample.
The heterogeneous parcels, more delicate than uniform covers.
And the dates covered within the season, from sowing through to harvest.
One important observation follows. The second axis is the only one no budget compresses, an agricultural campaign lasting a whole year, which means a corpus covering three campaigns presupposes three years of collection whatever effort is committed.
What the provider brings here
Four contributions distinguish an agricultural engagement conducted on satellite imagery.
Reasoning conducted on the whole time series rather than on one image.
Deliberate coverage of the territory’s most minority crops.
A delivery calendar aligned on the date at which the result still serves.
And annotators knowing precisely the cropping calendars of the region handled.
One important practical consequence follows. The third contribution weighs more than one imagines on this subject, a late delivery entirely cancelling the value of work that is otherwise accurate, which makes the delivery calendar a contractual commitment rather than a mere indication.
Approaching an agricultural project
Five questions scope such a satellite imagery project.
Do parcel boundaries come from a register. Otherwise they are invisible.
How many acquisitions cover the season. The calendar discriminates.
What area accuracy is expected. A payment changes everything.
Do minority crops count. They vanish into the average.
And by what date is the result expected. That bounds what is possible.
Those five answers determine the project’s feasibility. Asking them before the campaign starts avoids a result that is perfectly accurate but delivered too late to serve.
The question that frames the project
One question determines the arrangement needed in satellite imagery.
Does the result serve to check or to advise.
A check, verification of declarations or of practices, requires an exact geometry, a reference independent of the declarations and traceability of the decision.
Advice, condition monitoring or spotting zones to treat, requires a high frequency, a rapid delivery and tolerates an approximate geometry.
That question belongs to the use and not to technique, it is asked before the campaign, and it separates two projects whose rhythm and geometric demands bear no comparison.
Three decisions before producing
Three decisions commit an agricultural project in satellite imagery.
Obtaining the parcel register, without which the boundaries stay invisible.
Planning acquisitions around harvest, the most discriminating moment.
And fixing the date by which the result must be delivered to serve.
Those three decisions cost one meeting, they precede the start of the campaign, and their absence produces a result that is perfectly accurate but delivered too late to serve.
Three checks on an agricultural corpus
Three checks qualify an agricultural dataset in satellite imagery.
The actual availability of a parcel register for delimiting the surfaces.
The number of acquisitions covering the season, especially around harvest.
And the actual presence of minority crops among the annotated examples.
Those three checks are each asked in one question, they require no particular agronomic competence, and their absence indicates a corpus whose announced accuracy reflects above all the territory’s two or three dominant crops.
What this chapter teaches
One cross-cutting observation deserves closing this examination.
A parcel is an administrative entity the image does not show.
Three findings compose it.
Two parcels cropped identically by different farmers are indistinguishable.
The calendar discriminates crops better than appearance at a given date.
And an index flags an anomaly without ever designating its cause.
That finding extends the preceding chapter, an environment managed by people depending on decisions the image does not contain.
What this chapter leaves to the next
An index is computed on bands the eye does not perceive.
Three questions stay open in satellite imagery.
What the bands lying outside the visible spectrum genuinely bring.
How to annotate data the annotator simply cannot see.
And which colour composites finally make those bands usable.
Those three questions belong to multispectral imagery, which constitutes the subject of the following chapter.
Why the register question comes first
One item settles more about this kind of project than any other.
Ask whether the client can supply the parcel register before anything else.
Three reasons follow in satellite imagery.
Without it the boundaries cannot be recovered from imagery at all.
With it the work drops to assigning a class per parcel.
And the cost gap between the two runs to several times over.
One important practical consequence follows for a satellite imagery provider. Asking this in the first conversation reframes the whole quotation, since a client holding the register often does not realise it is the single largest lever on price, and a client without one needs to hear early that no resolution will substitute for it.
Common mistakes
These failures recur often enough that naming them is usually enough to avoid them.
- Looking for parcel boundaries on the image rather than in a register.
- Identifying a crop from a single acquisition.
- Evaluating a declaration check against the declarations themselves.
- Neglecting the harvest period when planning acquisitions.
- Confusing a low index with a diagnosis.
- Measuring an overall accuracy despite very minority crops.
- Comparing two years without aligning dates on the cropping calendar.
- Ignoring grass margins in the area calculation.
- Delivering an identification after the date it was useful.
- Assuming an identical cropping calendar from one region to another.
What to take away
Agricultural observation depends on information the image does not contain.
Three readings emerge. Two parcels cropped identically by different farmers are indistinguishable on any image, which makes the parcel register indispensable rather than merely useful. The calendar discriminates crops far better than appearance at a given date, two cereals resembling each other entirely in full growth and separating clearly by their harvest date, which makes the time series more decisive than resolution. And a computed index flags an anomaly without ever designating its cause, which leaves entirely open the question the annotation must settle.
For spectral bands, the article on multispectral imagery details the methods. For networks, the article on infrastructure mapping sets it out.
To explore delivery arrangements, supported formats and applicable control mechanisms, see our dedicated page on annotation for geospatial. And if you are preparing an agricultural project, let us discuss your need.